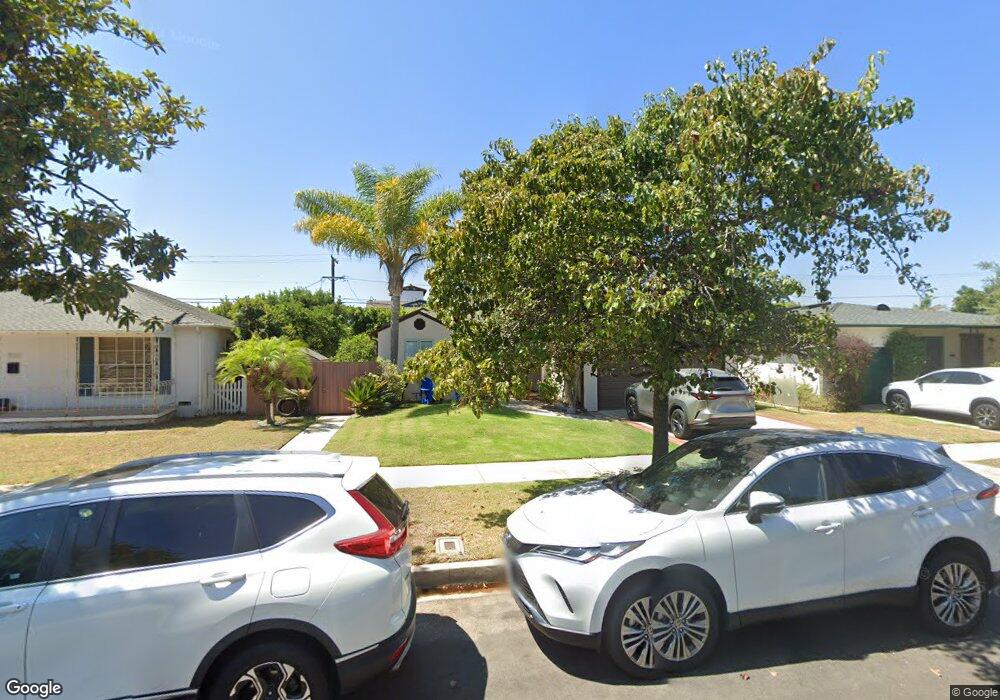
7927 Nardian Way Los Angeles, CA 90045
Westchester NeighborhoodEstimated Value: $1,777,000 - $2,810,000
3
Beds
2
Baths
1,850
Sq Ft
$1,154/Sq Ft
Est. Value
About This Home
This home is located at 7927 Nardian Way, Los Angeles, CA 90045 and is currently estimated at $2,134,828, approximately $1,153 per square foot. 7927 Nardian Way is a home located in Los Angeles County with nearby schools including Loyola Village Elementary School, Wright Middle School STEAM Magnet, and Westchester Enriched Sciences Magnets.
Ownership History
Date
Name
Owned For
Owner Type
Purchase Details
Closed on
Jun 4, 2023
Sold by
Morales Eric and Morales Debra
Bought by
2020 Morales Family Trust and Morales
Current Estimated Value
Purchase Details
Closed on
Nov 9, 2005
Sold by
Morales Eric Daniel and Morales Debra Ann
Bought by
Morales Eric
Home Financials for this Owner
Home Financials are based on the most recent Mortgage that was taken out on this home.
Original Mortgage
$910,000
Interest Rate
6.25%
Mortgage Type
Purchase Money Mortgage
Purchase Details
Closed on
Nov 19, 2001
Sold by
Seymour Grace and The Seymour Trust
Bought by
Morales Eric Daniel
Home Financials for this Owner
Home Financials are based on the most recent Mortgage that was taken out on this home.
Original Mortgage
$430,000
Interest Rate
6.39%
Purchase Details
Closed on
Apr 30, 2001
Sold by
Seymour Grace and Seymour Trust
Bought by
Seymour Grace and Seymour Trust
Create a Home Valuation Report for This Property
The Home Valuation Report is an in-depth analysis detailing your home's value as well as a comparison with similar homes in the area
Home Values in the Area
Average Home Value in this Area
Purchase History
| Date | Buyer | Sale Price | Title Company |
|---|---|---|---|
| 2020 Morales Family Trust | -- | None Listed On Document | |
| Morales Eric | -- | None Listed On Document | |
| Morales Eric | -- | Gateway Title Company | |
| Morales Eric Daniel | $537,500 | Equity Title | |
| Seymour Grace | -- | -- |
Source: Public Records
Mortgage History
| Date | Status | Borrower | Loan Amount |
|---|---|---|---|
| Previous Owner | Morales Eric | $910,000 | |
| Previous Owner | Morales Eric Daniel | $430,000 |
Source: Public Records
Tax History Compared to Growth
Tax History
| Year | Tax Paid | Tax Assessment Tax Assessment Total Assessment is a certain percentage of the fair market value that is determined by local assessors to be the total taxable value of land and additions on the property. | Land | Improvement |
|---|---|---|---|---|
| 2025 | $10,340 | $859,713 | $566,829 | $292,884 |
| 2024 | $10,340 | $842,857 | $555,715 | $287,142 |
| 2023 | $10,143 | $826,331 | $544,819 | $281,512 |
| 2022 | $9,675 | $810,130 | $534,137 | $275,993 |
| 2021 | $9,546 | $794,246 | $523,664 | $270,582 |
| 2019 | $9,259 | $770,690 | $508,133 | $262,557 |
| 2018 | $9,178 | $755,579 | $498,170 | $257,409 |
| 2016 | $8,762 | $726,240 | $478,826 | $247,414 |
| 2015 | $8,633 | $715,332 | $471,634 | $243,698 |
| 2014 | $8,665 | $701,321 | $462,396 | $238,925 |
Source: Public Records
Map
Nearby Homes
- 8057 Nardian Way
- 8301 Rayford Dr
- 7100 Playa Vista Dr Unit 120
- 7100 Playa Vista Dr Unit 406
- 7346 W 83rd St
- 7262 W 85th St
- 8136 Holy Cross Place
- 13042 W North Icon Cir
- 8309 Regis Way
- 6400 Crescent Park E Unit 121
- 13044 Pacific Promenade Unit 308
- 6099 S Seabluff Dr
- 13200 Pacific Promenade Prome Unit 409
- 12923 Bluff Creek Dr
- 13200 Pacific Promenade Unit 212
- 13200 Pacific Promenade Unit 420
- 7406 W 85th St
- 13020 Pacific Promenade Unit 303
- 7809 Mcconnell Ave
- 13075 Pacific Promenade Unit 318
- 7917 Nardian Way
- 7931 Nardian Way
- 7937 Nardian Way
- 7911 Nardian Way
- 7908 Altavan Ave
- 7904 Altavan Ave
- 7918 Altavan Ave
- 7900 Altavan Ave
- 7922 Altavan Ave
- 7941 Nardian Way
- 7834 Altavan Ave
- 7916 Nardian Way
- 7910 Nardian Way
- 7903 Nardian Way
- 7922 Nardian Way
- 7928 Altavan Ave
- 7928 Altavan Ave
- 7906 Nardian Way
- 7928 Nardian Way
- 7830 Altavan Ave