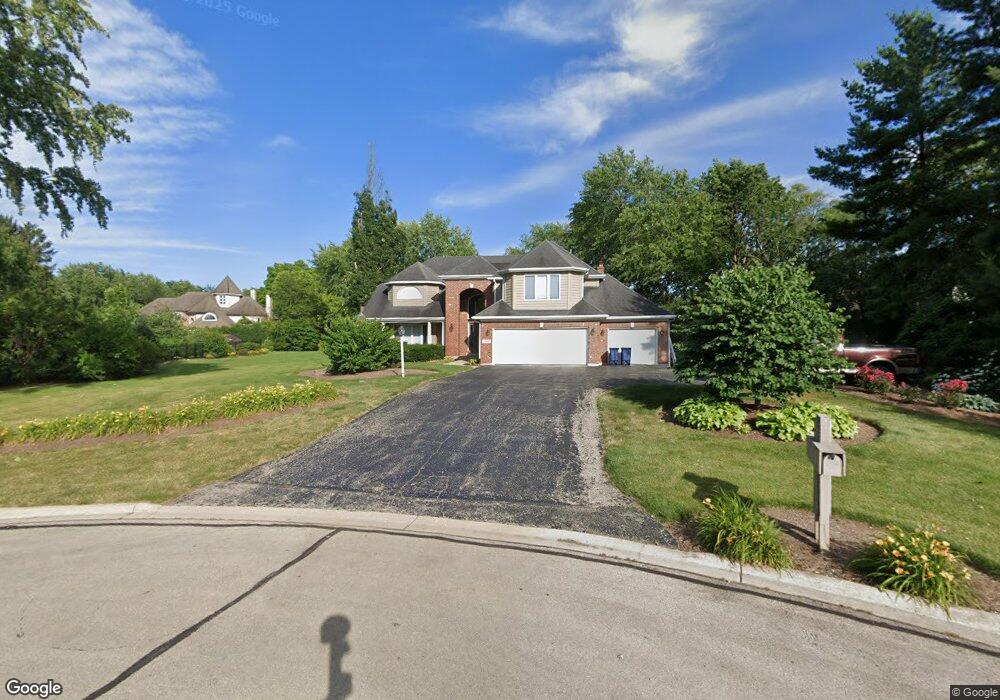
7S685 Carriage Way Ct Naperville, IL 60540
Huntington Hill NeighborhoodEstimated Value: $919,000 - $1,527,000
--
Bed
--
Bath
4,147
Sq Ft
$306/Sq Ft
Est. Value
About This Home
This home is located at 7S685 Carriage Way Ct, Naperville, IL 60540 and is currently estimated at $1,268,336, approximately $305 per square foot. 7S685 Carriage Way Ct is a home located in DuPage County with nearby schools including Highlands Elementary School, Kennedy Junior High School, and Naperville North High School.
Ownership History
Date
Name
Owned For
Owner Type
Purchase Details
Closed on
Jul 17, 2025
Sold by
Pickar Leo A and Pickar Susan A
Bought by
Leo A Pickar Revocable Trust and Pickar
Current Estimated Value
Purchase Details
Closed on
Oct 2, 2018
Sold by
Sinibaldi Mark R and Sinibaldi Janet M
Bought by
Pickar Leo A and Pickar Susan A
Purchase Details
Closed on
Nov 9, 1993
Sold by
Bambule James A and Bambule Patricia C
Bought by
Sinibaldi Mark R and Sinibaldi Janet M
Home Financials for this Owner
Home Financials are based on the most recent Mortgage that was taken out on this home.
Original Mortgage
$362,036
Interest Rate
7.5%
Mortgage Type
Construction
Create a Home Valuation Report for This Property
The Home Valuation Report is an in-depth analysis detailing your home's value as well as a comparison with similar homes in the area
Home Values in the Area
Average Home Value in this Area
Purchase History
| Date | Buyer | Sale Price | Title Company |
|---|---|---|---|
| Leo A Pickar Revocable Trust | -- | None Listed On Document | |
| Pickar Leo A | -- | Home Closing Services Inc | |
| Sinibaldi Mark R | $300,000 | First American Title Insuran |
Source: Public Records
Mortgage History
| Date | Status | Borrower | Loan Amount |
|---|---|---|---|
| Previous Owner | Sinibaldi Mark R | $550,000 | |
| Previous Owner | Sinibaldi Mark R | $475,200 | |
| Previous Owner | Sinibaldi Mark R | $250,000 | |
| Previous Owner | Sinibaldi Mark R | $478,200 | |
| Previous Owner | Sinibaldi Mark R | $250,000 | |
| Previous Owner | Sinibaldi Mark R | $17,700 | |
| Previous Owner | Sinibaldi Mark R | $493,250 | |
| Previous Owner | Sinibaldi Mark R | $362,036 |
Source: Public Records
Tax History Compared to Growth
Tax History
| Year | Tax Paid | Tax Assessment Tax Assessment Total Assessment is a certain percentage of the fair market value that is determined by local assessors to be the total taxable value of land and additions on the property. | Land | Improvement |
|---|---|---|---|---|
| 2024 | $19,792 | $347,414 | $113,712 | $233,702 |
| 2023 | $19,096 | $317,070 | $103,780 | $213,290 |
| 2022 | $17,739 | $294,950 | $96,540 | $198,410 |
| 2021 | $17,037 | $283,800 | $92,890 | $190,910 |
| 2020 | $16,657 | $278,700 | $91,220 | $187,480 |
| 2019 | $16,223 | $266,640 | $87,270 | $179,370 |
| 2018 | $17,100 | $285,010 | $87,270 | $197,740 |
| 2017 | $16,799 | $275,400 | $84,330 | $191,070 |
| 2016 | $16,446 | $265,440 | $81,280 | $184,160 |
| 2015 | $16,340 | $249,960 | $76,540 | $173,420 |
| 2014 | $16,755 | $249,960 | $76,540 | $173,420 |
| 2013 | $16,531 | $250,560 | $76,720 | $173,840 |
Source: Public Records
Map
Nearby Homes
- 1105 Johnson Dr
- 907 Secretariat Dr
- 923 Tim Tam Cir
- 1006 Bankfield Ct
- 625 Edward Rd
- 1300 Old Dominion Rd
- 1386 Old Dominion Ct
- 8S452 Bell Dr
- 908 Julian Ct
- 1216 Tranquility Ct
- 616 Driftwood Ct
- 1408 Swallow St
- 1449 Whitespire Ct Unit 5104
- 820 Prairie Ave
- 488 S Columbia St
- 821 Wellner Rd
- 165 Tamarack Ave
- 440 S Columbia St
- 1133 Catherine Ave
- 706 S Loomis St Unit D
- 1115 Kenilworth Cir
- 1119 Kenilworth Cir
- 7S665 Carriage Way Ct
- 1111 Kenilworth Cir
- 1121 Kenilworth Cir
- 7S700 Carriage Way Ct
- 997 Kenilworth Cir
- 7S670 Carriage Way Ct
- 1125 Kenilworth Cir
- 993 Kenilworth Cir
- 7S648 Carriage Way Ct
- 7S645 Carriage Way Ct Unit 2
- 1127 Stuart Ct
- 989 Kenilworth Cir
- 1129 Kenilworth Cir
- 1126 Stuart Ct
- 985 Kenilworth Cir
- 1131 Stuart Ct
- 1133 Kenilworth Cir
- 1130 Stuart Ct Unit 2