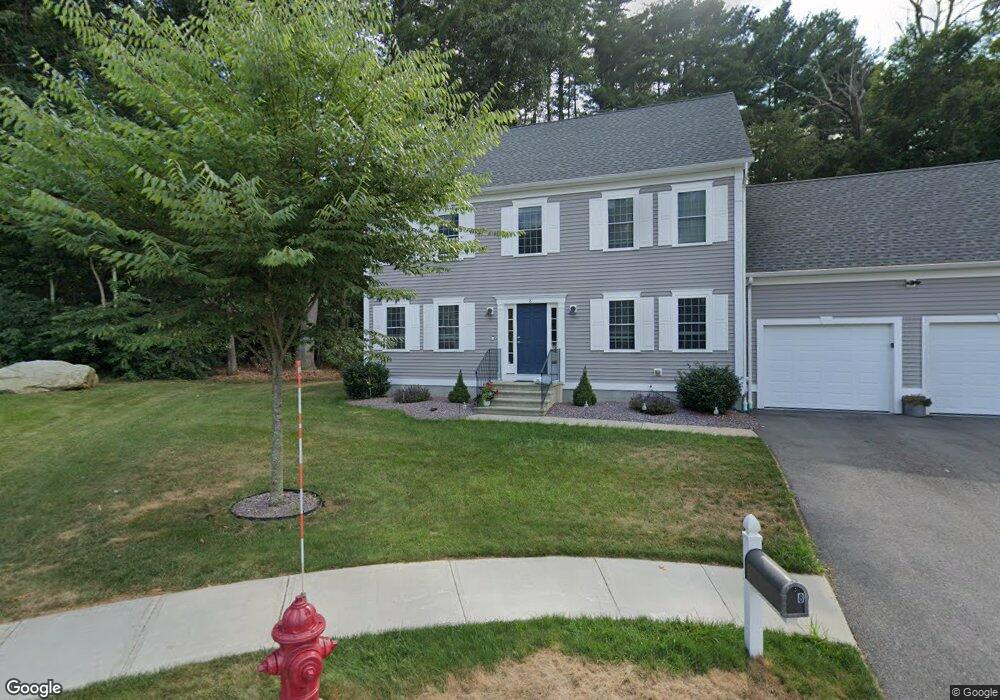
8 Desrosiers Landing South Grafton, MA 01560
Estimated Value: $685,000 - $991,000
4
Beds
3
Baths
1,872
Sq Ft
$418/Sq Ft
Est. Value
About This Home
This home is located at 8 Desrosiers Landing, South Grafton, MA 01560 and is currently estimated at $783,257, approximately $418 per square foot. 8 Desrosiers Landing is a home with nearby schools including Grafton High School and Silver Spruce Montessori School.
Ownership History
Date
Name
Owned For
Owner Type
Purchase Details
Closed on
May 29, 2015
Sold by
Kady Charles
Bought by
Hohnecker James B and Hohnecker Andrea L
Current Estimated Value
Home Financials for this Owner
Home Financials are based on the most recent Mortgage that was taken out on this home.
Original Mortgage
$378,000
Outstanding Balance
$290,036
Interest Rate
3.65%
Mortgage Type
New Conventional
Estimated Equity
$493,221
Purchase Details
Closed on
Nov 14, 2014
Sold by
Kady Charles
Bought by
Kiefer John M
Create a Home Valuation Report for This Property
The Home Valuation Report is an in-depth analysis detailing your home's value as well as a comparison with similar homes in the area
Home Values in the Area
Average Home Value in this Area
Purchase History
| Date | Buyer | Sale Price | Title Company |
|---|---|---|---|
| Hohnecker James B | $420,000 | -- | |
| Kiefer John M | $449,900 | -- |
Source: Public Records
Mortgage History
| Date | Status | Borrower | Loan Amount |
|---|---|---|---|
| Open | Hohnecker James B | $378,000 | |
| Closed | Hohnecker James B | $378,000 |
Source: Public Records
Tax History Compared to Growth
Tax History
| Year | Tax Paid | Tax Assessment Tax Assessment Total Assessment is a certain percentage of the fair market value that is determined by local assessors to be the total taxable value of land and additions on the property. | Land | Improvement |
|---|---|---|---|---|
| 2025 | $9,474 | $679,600 | $179,800 | $499,800 |
| 2024 | $9,290 | $649,200 | $171,200 | $478,000 |
| 2023 | $8,485 | $540,100 | $171,200 | $368,900 |
| 2022 | $8,004 | $474,200 | $147,000 | $327,200 |
| 2021 | $7,891 | $459,300 | $133,700 | $325,600 |
| 2020 | $7,517 | $455,600 | $133,700 | $321,900 |
| 2019 | $7,432 | $446,100 | $129,800 | $316,300 |
| 2018 | $6,882 | $414,800 | $129,000 | $285,800 |
| 2017 | $6,678 | $407,200 | $121,400 | $285,800 |
| 2016 | $6,507 | $388,500 | $97,500 | $291,000 |
| 2015 | $1,440 | $87,300 | $87,300 | $0 |
| 2014 | -- | $96,700 | $96,700 | $0 |
Source: Public Records
Map
Nearby Homes
- 7 Pine Hill Rd
- 109 Main St
- 110 Main St
- 58 Fisherville Terrace
- 44 Fisherville Terrace
- 55 Fisherville Terrace
- 185 Main St
- 29 Sampson St Unit 29
- 50 Highland View Dr
- 90 Leland Hill Rd
- 115 Ariel Cir
- 150 Ariel Cir
- 191 Hartness Rd
- 29 Highland View Dr
- 19 Wildflower Dr
- 7 B Herbert Dr Unit 14
- 151 Providence Rd Unit 24
- 5 Wildflower Dr
- 13 Pullard Rd Unit 38
- 29 Pullard Rd
- 9 Desrosiers Landing
- 6 Desrosiers Landing
- 5 Krula Way
- 7 Desrosiers Landing
- 4 Desrosiers Landing
- 7 Krula Way
- 4 Desrosiers Landing
- 10 Farnum St
- 8 Farnum St
- 5 Desrosiers Landing
- 144 Main St
- 12 Farnum St
- 6 Farnum St
- 3 Krula Way
- 3 Desrosiers Landing
- 4 Farnum St
- 9 Farnum St
- 6 Krula Way
- 146 Main St
- 61 Elmwood St