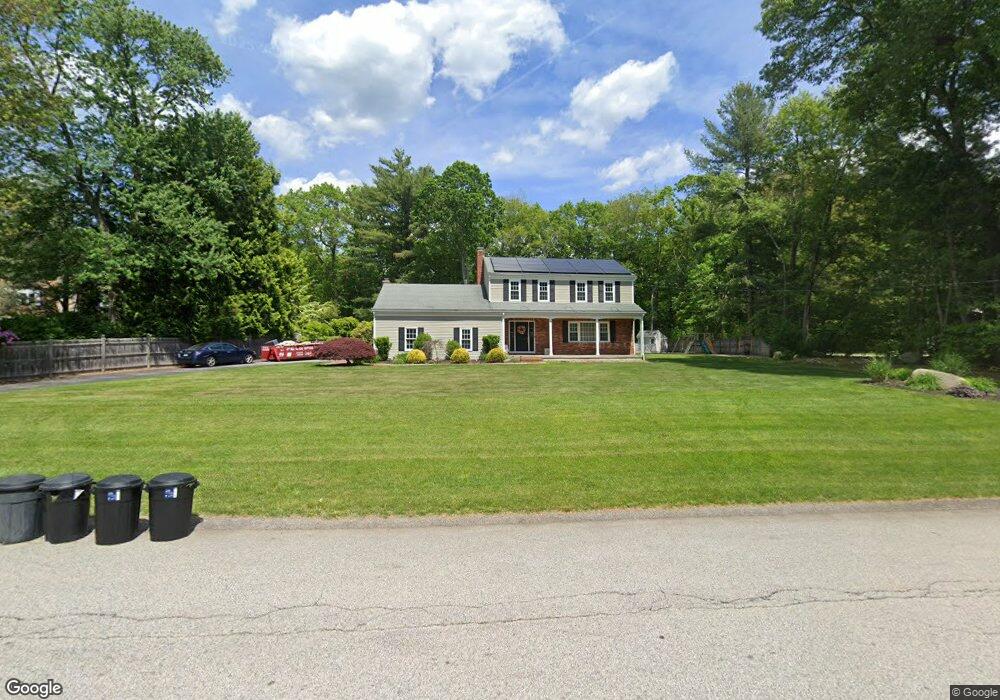
8 Lori Ellen Dr Smithfield, RI 02917
Estimated Value: $682,214 - $795,000
3
Beds
3
Baths
2,710
Sq Ft
$274/Sq Ft
Est. Value
About This Home
This home is located at 8 Lori Ellen Dr, Smithfield, RI 02917 and is currently estimated at $742,804, approximately $274 per square foot. 8 Lori Ellen Dr is a home located in Providence County with nearby schools including Raymond Laperche School, Vincent J. Gallagher Middle School, and Smithfield High School.
Ownership History
Date
Name
Owned For
Owner Type
Purchase Details
Closed on
May 22, 2020
Sold by
Mayer William E Est and Mayer
Bought by
Bannon Craig and Bannon Kristen M
Current Estimated Value
Home Financials for this Owner
Home Financials are based on the most recent Mortgage that was taken out on this home.
Original Mortgage
$391,500
Outstanding Balance
$345,400
Interest Rate
3.3%
Mortgage Type
New Conventional
Estimated Equity
$397,404
Purchase Details
Closed on
Jun 11, 2014
Sold by
Mayer William E and Mayer Mary A
Bought by
Mayer William E
Purchase Details
Closed on
Aug 22, 1995
Sold by
Leone Richard and Leone Karen
Bought by
Mayer William E and Mayer Mary
Purchase Details
Closed on
May 26, 1989
Sold by
Courtot George A
Bought by
Leone Richard
Create a Home Valuation Report for This Property
The Home Valuation Report is an in-depth analysis detailing your home's value as well as a comparison with similar homes in the area
Home Values in the Area
Average Home Value in this Area
Purchase History
| Date | Buyer | Sale Price | Title Company |
|---|---|---|---|
| Bannon Craig | $435,000 | None Available | |
| Bannon Craig | $435,000 | None Available | |
| Bannon Craig | $435,000 | None Available | |
| Mayer William E | -- | -- | |
| Mayer William E | -- | -- | |
| Mayer William E | $213,500 | -- | |
| Mayer William E | $213,500 | -- | |
| Leone Richard | $240,000 | -- | |
| Leone Richard | $240,000 | -- |
Source: Public Records
Mortgage History
| Date | Status | Borrower | Loan Amount |
|---|---|---|---|
| Open | Bannon Craig | $391,500 | |
| Closed | Bannon Craig | $391,500 | |
| Previous Owner | Leone Richard | $372,000 | |
| Previous Owner | Leone Richard | $250,000 |
Source: Public Records
Tax History Compared to Growth
Tax History
| Year | Tax Paid | Tax Assessment Tax Assessment Total Assessment is a certain percentage of the fair market value that is determined by local assessors to be the total taxable value of land and additions on the property. | Land | Improvement |
|---|---|---|---|---|
| 2025 | $6,822 | $550,600 | $171,000 | $379,600 |
| 2024 | $6,637 | $459,600 | $144,800 | $314,800 |
| 2023 | $6,306 | $459,600 | $144,800 | $314,800 |
| 2022 | $6,140 | $459,600 | $144,800 | $314,800 |
| 2021 | $5,958 | $347,800 | $105,700 | $242,100 |
| 2020 | $5,847 | $347,800 | $105,700 | $242,100 |
| 2019 | $5,847 | $347,800 | $105,700 | $242,100 |
| 2018 | $6,007 | $342,100 | $120,800 | $221,300 |
| 2017 | $6,007 | $342,100 | $120,800 | $221,300 |
| 2016 | $5,723 | $342,100 | $120,800 | $221,300 |
| 2015 | $5,658 | $322,000 | $107,800 | $214,200 |
| 2012 | $5,863 | $366,000 | $129,700 | $236,300 |
Source: Public Records
Map
Nearby Homes
- 61 Harris Rd
- 23 Maureen Dr
- 38 Clark Rd
- 8 Sunset Dr
- 14 Domin Ave
- 1 W Farm Rd
- 1 Victoria Dr
- 24 Whipple Rd
- 15 Scenic View Dr
- 15 Higgins St Unit 123
- 117 Farnum Pike
- 18 Homestead Ave
- 4 Tattersall Dr
- 6 Desiree Ct Unit A
- 24 Greenwood Ln
- 1 Old County Village Way Unit E
- 16 Louise Ann Dr
- 48 Pheasant Run Unit A
- 3 Desiree Ct Unit C
- 250 George Washington Hwy
- 6 Lori Ellen Dr
- 10 Lori Ellen Dr
- 7 Price Ln
- 11 Lori Ellen Dr
- 4 Lori Ellen Dr
- 15 Lori Ellen Dr
- 12 Lori Ellen Dr
- 9 Price Ln
- 9 Lori Ellen Dr
- 7 Lori Ellen Dr
- 5 Price Ln
- 17 Lori Ellen Dr
- 2 Lori Ellen Dr
- 5 Lori Ellen Dr
- 11 Price Ln
- 31 Karen Ann Dr
- 105 Orchard Meadows Dr
- 4 Price Ln
- 107 Orchard Meadows Dr
- 107 Orchard Meadows Dr Unit 107