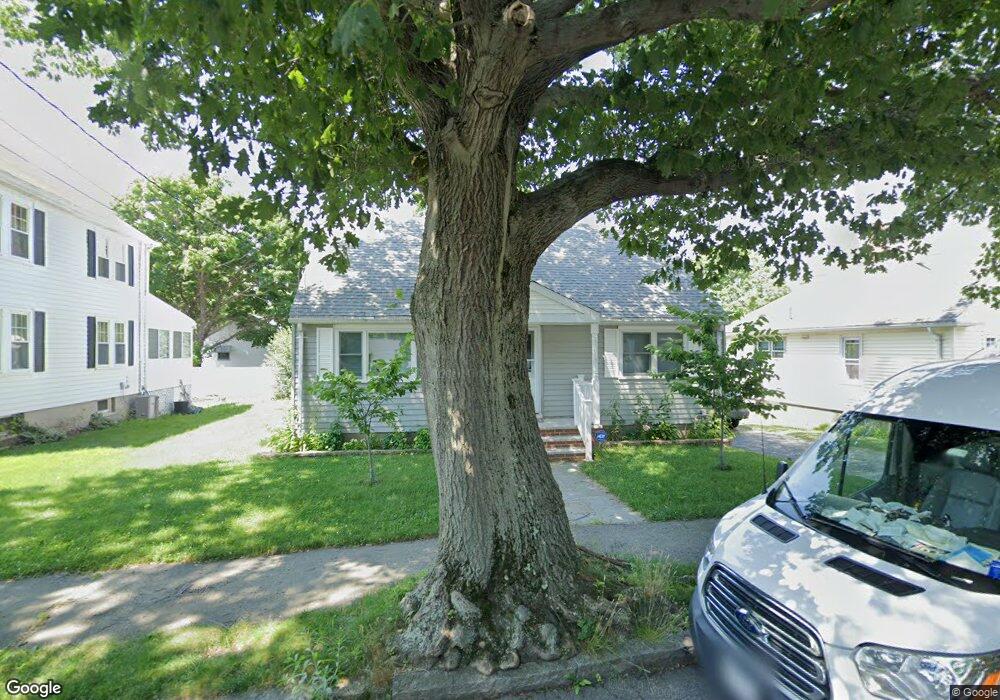
8 Montillio St Quincy, MA 02169
Estimated Value: $473,000 - $669,000
2
Beds
1
Bath
1,224
Sq Ft
$473/Sq Ft
Est. Value
About This Home
This home is located at 8 Montillio St, Quincy, MA 02169 and is currently estimated at $578,380, approximately $472 per square foot. 8 Montillio St is a home located in Norfolk County with nearby schools including South West Middle School, Lincoln-Hancock Community School, and Quincy High School.
Ownership History
Date
Name
Owned For
Owner Type
Purchase Details
Closed on
Apr 22, 2010
Sold by
Solander John P and Monti Jill
Bought by
Tran Linh
Current Estimated Value
Home Financials for this Owner
Home Financials are based on the most recent Mortgage that was taken out on this home.
Original Mortgage
$200,000
Outstanding Balance
$133,207
Interest Rate
5%
Mortgage Type
Purchase Money Mortgage
Estimated Equity
$445,173
Create a Home Valuation Report for This Property
The Home Valuation Report is an in-depth analysis detailing your home's value as well as a comparison with similar homes in the area
Home Values in the Area
Average Home Value in this Area
Purchase History
| Date | Buyer | Sale Price | Title Company |
|---|---|---|---|
| Tran Linh | $250,000 | -- |
Source: Public Records
Mortgage History
| Date | Status | Borrower | Loan Amount |
|---|---|---|---|
| Open | Tran Linh | $200,000 |
Source: Public Records
Tax History Compared to Growth
Tax History
| Year | Tax Paid | Tax Assessment Tax Assessment Total Assessment is a certain percentage of the fair market value that is determined by local assessors to be the total taxable value of land and additions on the property. | Land | Improvement |
|---|---|---|---|---|
| 2025 | $6,139 | $532,400 | $260,400 | $272,000 |
| 2024 | $5,833 | $517,600 | $248,000 | $269,600 |
| 2023 | $5,556 | $499,200 | $236,200 | $263,000 |
| 2022 | $5,288 | $441,400 | $188,900 | $252,500 |
| 2021 | $5,190 | $427,500 | $188,900 | $238,600 |
| 2020 | $5,161 | $415,200 | $188,900 | $226,300 |
| 2019 | $4,790 | $381,700 | $183,500 | $198,200 |
| 2018 | $4,778 | $358,200 | $169,800 | $188,400 |
| 2017 | $4,554 | $321,400 | $161,800 | $159,600 |
| 2016 | $4,249 | $295,900 | $147,000 | $148,900 |
| 2015 | $4,021 | $275,400 | $138,700 | $136,700 |
| 2014 | $3,841 | $258,500 | $138,700 | $119,800 |
Source: Public Records
Map
Nearby Homes
- 63 Adele Rd
- 52 Bunker Hill Ln
- 211 West St Unit 12B
- 808 Willard St Unit F11
- 2 Ricciuti Dr Unit 8
- 55 Station St Unit 1
- 36 Greystone St Unit 36
- 57A West St
- 42 West St
- 72 Centre St Unit J
- 328 Copeland St Unit 3E
- 211 Copeland St
- 57 Buckley St
- 203 Centre St
- 145 Suomi Rd Unit C7
- 41 Filbert St
- 14 Arthur Ave
- 230 Willard St Unit 204
- 21 Arthur St
- 12 Arthur Ave