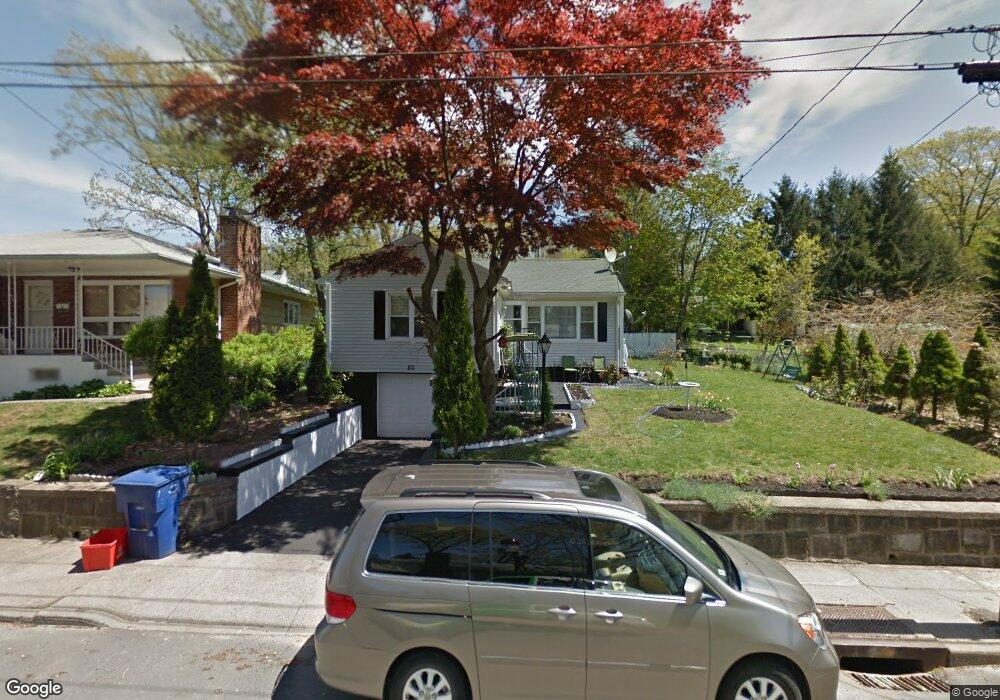
80 Fern St Waterbury, CT 06704
North End District NeighborhoodEstimated Value: $283,985 - $323,000
3
Beds
2
Baths
1,044
Sq Ft
$289/Sq Ft
Est. Value
About This Home
This home is located at 80 Fern St, Waterbury, CT 06704 and is currently estimated at $301,996, approximately $289 per square foot. 80 Fern St is a home located in New Haven County with nearby schools including F. J. Kingsbury School, North End Middle School, and Wilby High School.
Ownership History
Date
Name
Owned For
Owner Type
Purchase Details
Closed on
Aug 7, 2024
Sold by
Husain Omar
Bought by
Husain Omar and Husain Bibi A
Current Estimated Value
Purchase Details
Closed on
Oct 8, 1999
Sold by
Strleckis Todd
Bought by
Husain Omar
Purchase Details
Closed on
Dec 20, 1994
Sold by
Madnick Evelyn
Bought by
Strileckis Todd
Create a Home Valuation Report for This Property
The Home Valuation Report is an in-depth analysis detailing your home's value as well as a comparison with similar homes in the area
Home Values in the Area
Average Home Value in this Area
Purchase History
| Date | Buyer | Sale Price | Title Company |
|---|---|---|---|
| Husain Omar | -- | None Available | |
| Husain Omar | -- | None Available | |
| Husain Omar | $74,900 | -- | |
| Strileckis Todd | $65,000 | -- | |
| Husain Omar | $74,900 | -- | |
| Strileckis Todd | $65,000 | -- |
Source: Public Records
Mortgage History
| Date | Status | Borrower | Loan Amount |
|---|---|---|---|
| Previous Owner | Strileckis Todd | $108,635 | |
| Previous Owner | Strileckis Todd | $14,000 | |
| Previous Owner | Strileckis Todd | $120,000 |
Source: Public Records
Tax History Compared to Growth
Tax History
| Year | Tax Paid | Tax Assessment Tax Assessment Total Assessment is a certain percentage of the fair market value that is determined by local assessors to be the total taxable value of land and additions on the property. | Land | Improvement |
|---|---|---|---|---|
| 2025 | $4,931 | $109,620 | $19,600 | $90,020 |
| 2024 | $5,420 | $109,620 | $19,600 | $90,020 |
| 2023 | $5,940 | $109,620 | $19,600 | $90,020 |
| 2022 | $3,855 | $64,020 | $19,600 | $44,420 |
| 2021 | $3,855 | $64,020 | $19,600 | $44,420 |
| 2020 | $3,855 | $64,020 | $19,600 | $44,420 |
| 2019 | $3,855 | $64,020 | $19,600 | $44,420 |
| 2018 | $3,855 | $64,020 | $19,600 | $44,420 |
| 2017 | $3,762 | $62,480 | $19,600 | $42,880 |
| 2016 | $3,762 | $62,480 | $19,600 | $42,880 |
| 2015 | $3,638 | $62,480 | $19,600 | $42,880 |
| 2014 | $3,638 | $62,480 | $19,600 | $42,880 |
Source: Public Records
Map
Nearby Homes