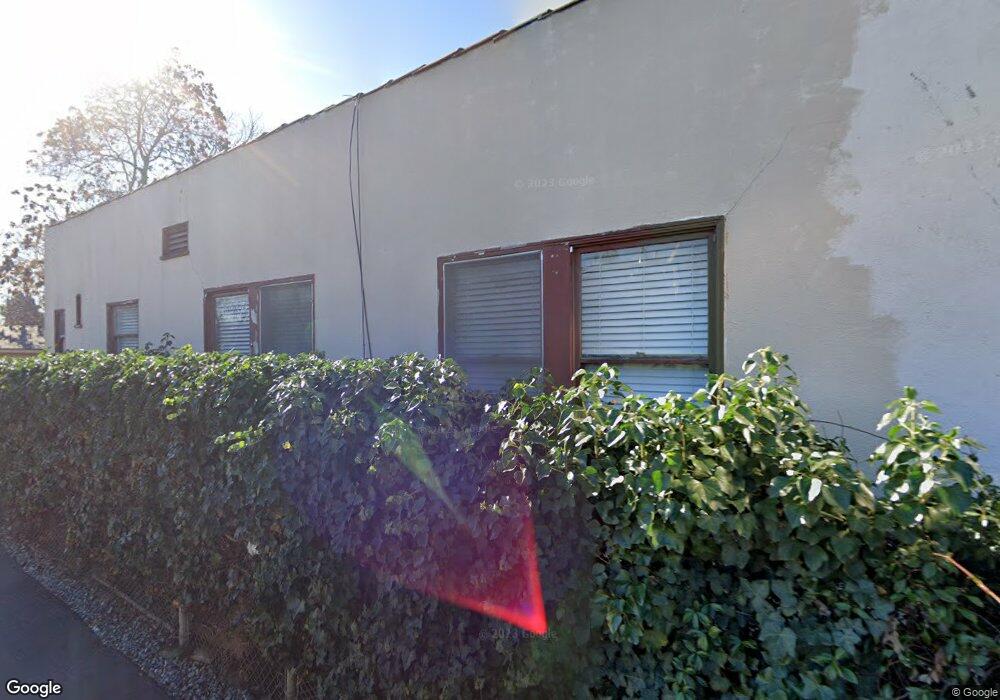
80 W Humboldt St San Jose, CA 95110
Tamien NeighborhoodEstimated Value: $890,000 - $1,148,000
2
Beds
1
Bath
1,141
Sq Ft
$842/Sq Ft
Est. Value
About This Home
This home is located at 80 W Humboldt St, San Jose, CA 95110 and is currently estimated at $961,110, approximately $842 per square foot. 80 W Humboldt St is a home located in Santa Clara County with nearby schools including Ernesto Galarza Elementary School, Willow Glen Middle, and Willow Glen High School.
Ownership History
Date
Name
Owned For
Owner Type
Purchase Details
Closed on
May 4, 2006
Sold by
Armas Esther M
Bought by
Armas Esther M and Armas Jaime
Current Estimated Value
Purchase Details
Closed on
May 25, 2000
Sold by
Jaime Armas and Armas Esther M
Bought by
Armas Esther M
Home Financials for this Owner
Home Financials are based on the most recent Mortgage that was taken out on this home.
Original Mortgage
$212,000
Outstanding Balance
$52,637
Interest Rate
4.2%
Estimated Equity
$908,473
Purchase Details
Closed on
Dec 29, 1995
Sold by
Gonzalez Graciela Reyes
Bought by
Armas Jaime
Home Financials for this Owner
Home Financials are based on the most recent Mortgage that was taken out on this home.
Original Mortgage
$147,700
Interest Rate
7.36%
Create a Home Valuation Report for This Property
The Home Valuation Report is an in-depth analysis detailing your home's value as well as a comparison with similar homes in the area
Home Values in the Area
Average Home Value in this Area
Purchase History
| Date | Buyer | Sale Price | Title Company |
|---|---|---|---|
| Armas Esther M | -- | None Available | |
| Armas Esther M | -- | Financial Title Company | |
| Armas Jaime | -- | Fidelity National Title Ins | |
| Armas Jaime | $155,500 | Fidelity National Title Ins |
Source: Public Records
Mortgage History
| Date | Status | Borrower | Loan Amount |
|---|---|---|---|
| Open | Armas Esther M | $212,000 | |
| Closed | Armas Jaime | $147,700 |
Source: Public Records
Tax History Compared to Growth
Tax History
| Year | Tax Paid | Tax Assessment Tax Assessment Total Assessment is a certain percentage of the fair market value that is determined by local assessors to be the total taxable value of land and additions on the property. | Land | Improvement |
|---|---|---|---|---|
| 2025 | $8,361 | $609,252 | $478,733 | $130,519 |
| 2024 | $8,361 | $597,307 | $469,347 | $127,960 |
| 2023 | $8,183 | $585,596 | $460,145 | $125,451 |
| 2022 | $8,112 | $574,115 | $451,123 | $122,992 |
| 2021 | $7,921 | $562,859 | $442,278 | $120,581 |
| 2020 | $7,721 | $557,088 | $437,743 | $119,345 |
| 2019 | $7,545 | $546,165 | $429,160 | $117,005 |
| 2018 | $7,459 | $535,457 | $420,746 | $114,711 |
| 2017 | $7,392 | $524,959 | $412,497 | $112,462 |
| 2016 | $7,309 | $514,666 | $404,409 | $110,257 |
| 2015 | $7,255 | $506,936 | $398,335 | $108,601 |
| 2014 | $6,814 | $497,007 | $390,533 | $106,474 |
Source: Public Records
Map
Nearby Homes
- 1210 Mastic St
- 198 Floyd St
- 82 Hollywood Ave
- 114 Hollywood Ave
- 1144 Locust St
- 1148 Palm St
- 1060 S 3rd St Unit 379
- 1060 S 3rd St Unit 179
- 1060 S 3rd St Unit 233
- 1060 S 3rd St Unit 216
- 1060 S 3rd St Unit 129
- 1060 S 3rd St Unit 344
- 1493 Sanborn Ave
- 1488 Pomona Ave
- 1497 Sanborn Ave
- 1376 Palm St
- 118 Cottage Grove Ave
- 896 S Almaden Ave
- 85 Oak St
- 316 Stonegate Cir
- 86 W Humboldt St
- 70 W Humboldt St
- 92 W Humboldt St
- 1224 Mastic St
- 66 W Humboldt St Unit 3
- 66 W Humboldt St
- 98 W Humboldt St
- 1234 Mastic St
- 1221 Sherman St
- 60 W Humboldt St
- 1227 Sherman St
- 77 W Humboldt St
- 1244 Mastic St
- 85 W Humboldt St
- 71 W Humboldt St
- 52 W Humboldt St
- 91 W Humboldt St
- 1235 Sherman St
- 65 W Humboldt St
- 97 W Humboldt St