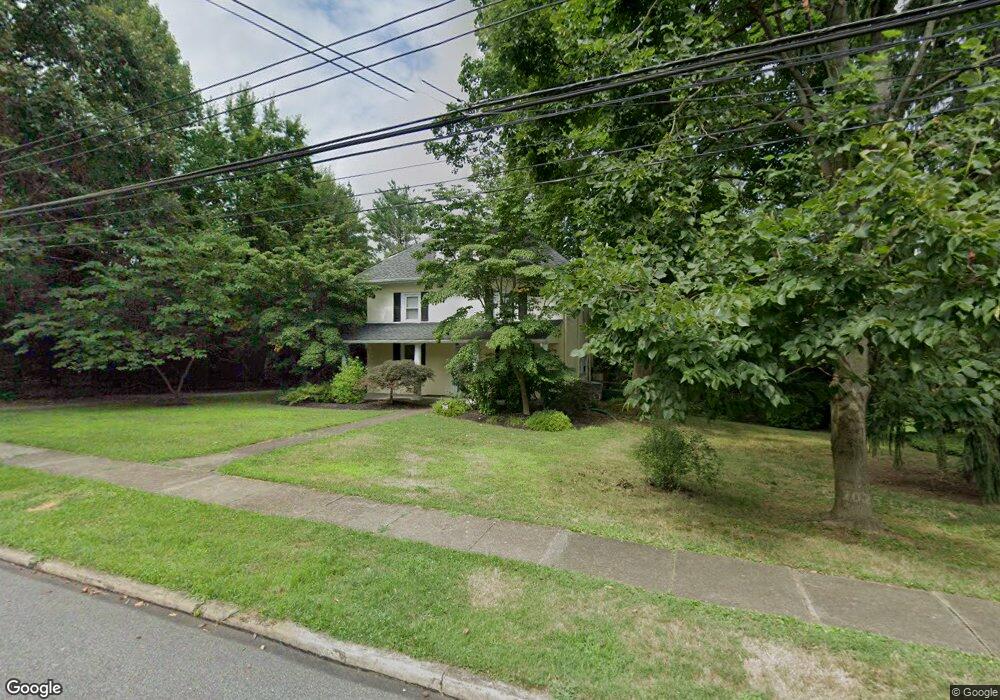
80 Yale Ave Swarthmore, PA 19081
Estimated Value: $1,352,000 - $1,715,000
4
Beds
3
Baths
3,446
Sq Ft
$456/Sq Ft
Est. Value
About This Home
This home is located at 80 Yale Ave, Swarthmore, PA 19081 and is currently estimated at $1,571,130, approximately $455 per square foot. 80 Yale Ave is a home located in Delaware County with nearby schools including Swarthmore-Rutledge School, Strath Haven Middle School, and Strath Haven High School.
Ownership History
Date
Name
Owned For
Owner Type
Purchase Details
Closed on
Nov 1, 2024
Sold by
Norkett John S and Klein Amy M
Bought by
Harvey Matthew B and Topper Paige N
Current Estimated Value
Home Financials for this Owner
Home Financials are based on the most recent Mortgage that was taken out on this home.
Original Mortgage
$1,260,000
Outstanding Balance
$1,248,058
Interest Rate
6.38%
Mortgage Type
New Conventional
Estimated Equity
$323,072
Purchase Details
Closed on
Mar 29, 2019
Sold by
Grove David L
Bought by
Norkett John S and Klein Amy M
Home Financials for this Owner
Home Financials are based on the most recent Mortgage that was taken out on this home.
Original Mortgage
$450,000
Interest Rate
4.3%
Mortgage Type
New Conventional
Purchase Details
Closed on
Jun 7, 2004
Sold by
Grove David L and Grove Barbara F
Bought by
Grove David L
Create a Home Valuation Report for This Property
The Home Valuation Report is an in-depth analysis detailing your home's value as well as a comparison with similar homes in the area
Home Values in the Area
Average Home Value in this Area
Purchase History
| Date | Buyer | Sale Price | Title Company |
|---|---|---|---|
| Harvey Matthew B | $1,575,000 | None Listed On Document | |
| Harvey Matthew B | $1,575,000 | None Listed On Document | |
| Norkett John S | $630,000 | Global Title Llc | |
| Grove David L | -- | Security Search & Abstract C |
Source: Public Records
Mortgage History
| Date | Status | Borrower | Loan Amount |
|---|---|---|---|
| Open | Harvey Matthew B | $1,260,000 | |
| Closed | Harvey Matthew B | $1,260,000 | |
| Previous Owner | Norkett John S | $450,000 |
Source: Public Records
Tax History Compared to Growth
Tax History
| Year | Tax Paid | Tax Assessment Tax Assessment Total Assessment is a certain percentage of the fair market value that is determined by local assessors to be the total taxable value of land and additions on the property. | Land | Improvement |
|---|---|---|---|---|
| 2025 | $20,209 | $560,800 | $125,150 | $435,650 |
| 2024 | $20,209 | $560,800 | $125,150 | $435,650 |
| 2023 | $19,426 | $560,800 | $125,150 | $435,650 |
| 2022 | $18,912 | $560,800 | $125,150 | $435,650 |
| 2021 | $30,416 | $553,760 | $125,150 | $428,610 |
| 2020 | $12,146 | $208,180 | $89,880 | $118,300 |
| 2019 | $11,840 | $208,180 | $89,880 | $118,300 |
| 2018 | $11,644 | $208,180 | $0 | $0 |
| 2017 | $11,382 | $208,180 | $0 | $0 |
| 2016 | $1,142 | $208,180 | $0 | $0 |
| 2015 | $1,166 | $208,180 | $0 | $0 |
| 2014 | $1,166 | $208,180 | $0 | $0 |
Source: Public Records
Map
Nearby Homes
- 345 Vassar Ave
- 354 S Swarthmore Ave Unit B3
- 1238 University Ave
- 1226 Redwood Ave
- 912 Edgewood Ave
- 630 Yale Ave
- 110 Park Ave Unit 370
- 110 Park Ave Unit 350
- 110 Park Ave Unit 250
- 110 Park Ave Unit 320
- 110 Park Ave Unit 220
- 110 Park Ave Unit 440
- 110 Park Ave Unit 460
- 110 Park Ave Unit 430
- 110 Park Ave Unit 210
- 110 Park Ave Unit 340
- 226 W Sylvan Ave
- 115 President Ave
- 120 Bridge St
- 516 Edgewood Ave
- 84 Yale Ave
- 333 Dickinson Ave
- 321 Dickinson Ave
- 337 Dickinson Ave
- 317 Dickinson Ave
- 304 N Lehigh Cir
- 300 N Lehigh Cir
- 315 Dickinson Ave
- 308 N Lehigh Cir
- 401 Dickinson Ave
- 336 Dickinson Ave
- 301 N Lehigh Cir
- 90 Yale Ave
- 1155 S Lehigh Cir
- 330 Dickinson Ave
- 334 Dickinson Ave
- 324 Dickinson Ave
- 1143 S Lehigh Cir
- 1151 S Lehigh Cir
- 1147 S Lehigh Cir