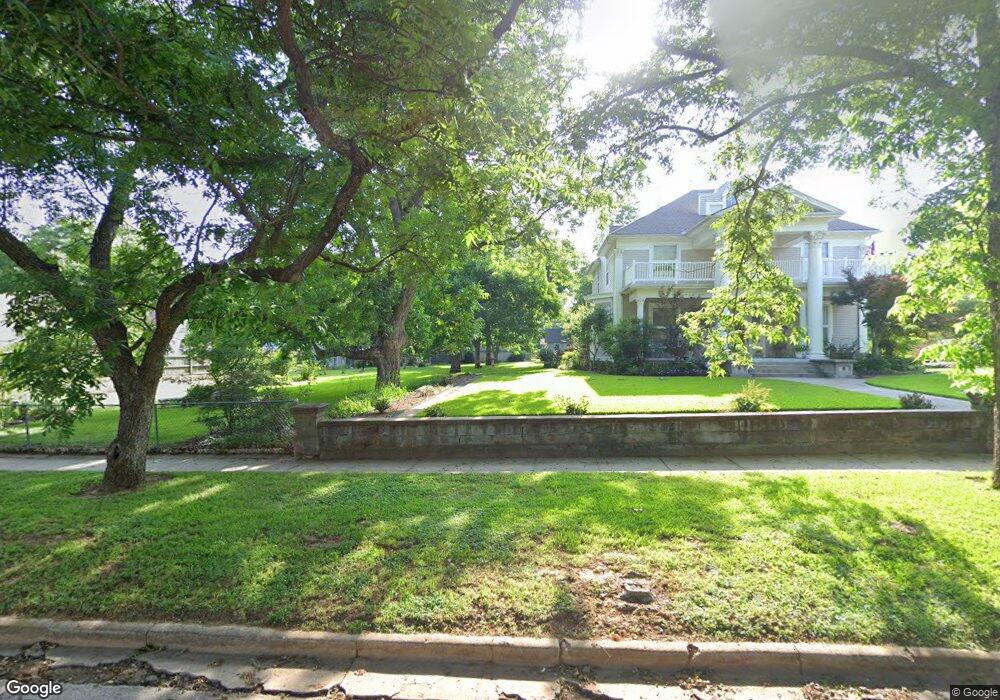
800 Grand Ardmore, OK 73401
Estimated Value: $493,965
--
Bed
--
Bath
2,457
Sq Ft
$201/Sq Ft
Est. Value
About This Home
This home is located at 800 Grand, Ardmore, OK 73401 and is currently estimated at $493,965, approximately $201 per square foot. 800 Grand is a home located in Carter County with nearby schools including Lincoln Elementary School, Ardmore Middle School, and Ardmore High School.
Ownership History
Date
Name
Owned For
Owner Type
Purchase Details
Closed on
Nov 14, 2024
Sold by
3N Properties Llc
Bought by
Johnston Properties & Investments Llc
Current Estimated Value
Purchase Details
Closed on
Feb 12, 2009
Sold by
Walls Buel M and Walls Buel Mckinley
Bought by
3N Properties Llc
Purchase Details
Closed on
Jun 1, 2005
Sold by
Morris Susanne Marie and Walls Susanne Marie
Bought by
Walls Buel M and Walls Buel Mckinley
Home Financials for this Owner
Home Financials are based on the most recent Mortgage that was taken out on this home.
Original Mortgage
$216,000
Interest Rate
5.83%
Mortgage Type
Commercial
Purchase Details
Closed on
Apr 5, 2001
Sold by
Billco Holding Co
Bought by
Walls Buel M and Walls Susanne
Create a Home Valuation Report for This Property
The Home Valuation Report is an in-depth analysis detailing your home's value as well as a comparison with similar homes in the area
Home Values in the Area
Average Home Value in this Area
Purchase History
| Date | Buyer | Sale Price | Title Company |
|---|---|---|---|
| Johnston Properties & Investments Llc | $460,000 | Stewart Title | |
| Johnston Properties & Investments Llc | $460,000 | Stewart Title | |
| 3N Properties Llc | $345,000 | -- | |
| Walls Buel M | -- | -- | |
| Walls Buel M | $205,000 | -- |
Source: Public Records
Mortgage History
| Date | Status | Borrower | Loan Amount |
|---|---|---|---|
| Previous Owner | Walls Buel M | $216,000 |
Source: Public Records
Tax History Compared to Growth
Tax History
| Year | Tax Paid | Tax Assessment Tax Assessment Total Assessment is a certain percentage of the fair market value that is determined by local assessors to be the total taxable value of land and additions on the property. | Land | Improvement |
|---|---|---|---|---|
| 2024 | $5,511 | $45,115 | $7,506 | $37,609 |
| 2023 | $4,503 | $42,967 | $7,506 | $35,461 |
| 2022 | $3,912 | $40,921 | $7,506 | $33,415 |
| 2021 | $5,853 | $58,015 | $7,506 | $50,509 |
| 2020 | $5,494 | $55,252 | $7,506 | $47,746 |
| 2019 | $5,109 | $52,621 | $7,506 | $45,115 |
| 2018 | $4,947 | $50,115 | $7,506 | $42,609 |
| 2017 | $4,408 | $48,216 | $7,506 | $40,710 |
| 2016 | $4,280 | $45,921 | $7,506 | $38,415 |
| 2015 | $3,360 | $43,734 | $7,506 | $36,228 |
| 2014 | $3,727 | $41,651 | $7,506 | $34,145 |
Source: Public Records
Map
Nearby Homes
- 615 3rd Ave NW
- 328 G St NW
- 518 3rd Ave NW
- 402 E St NW
- 501 NW E St St
- 1013 W Main St
- 606 W Broadway St
- 405 4th Ave NW
- 0 N Commerce St Unit 2517610
- 0 N Commerce St Unit 2530001
- 121 F St SW
- 731 8th Ave NW
- 808 H St NW
- 600 N Commerce St
- 811 Hargrove St
- 802 Northwest Blvd
- 809 H St NW
- 901 Wolverton St
- 610 C St NW
- 56 Joy Place