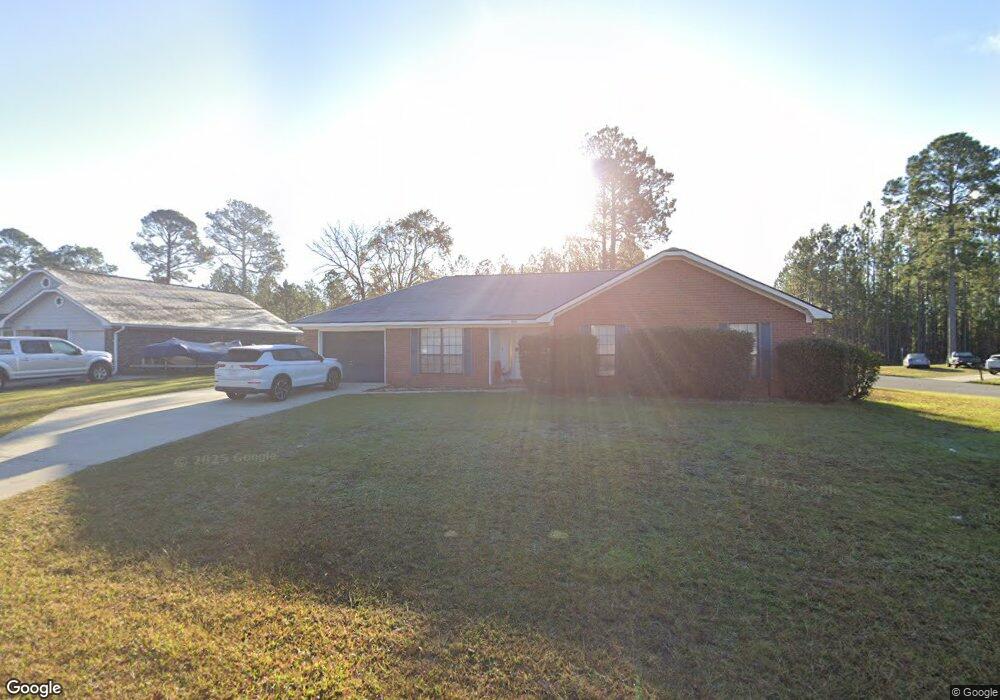
800 Malibu Dr Hinesville, GA 31313
Estimated Value: $190,000 - $229,000
3
Beds
2
Baths
1,453
Sq Ft
$149/Sq Ft
Est. Value
About This Home
This home is located at 800 Malibu Dr, Hinesville, GA 31313 and is currently estimated at $215,800, approximately $148 per square foot. 800 Malibu Dr is a home located in Liberty County with nearby schools including Waldo Pafford Elementary School, Snelson-Golden Middle School, and Bradwell Institute.
Ownership History
Date
Name
Owned For
Owner Type
Purchase Details
Closed on
Mar 14, 2018
Sold by
Tingley James A
Bought by
Jnt Home Rentals Corp
Current Estimated Value
Purchase Details
Closed on
Jun 11, 2013
Sold by
Sec Of Veterans Affa
Bought by
Tingley James A
Purchase Details
Closed on
Oct 2, 2012
Sold by
Jpmorgan Chase Bank Nation
Bought by
Sec Of Veterans Affairs and Countrywide Home Loans
Purchase Details
Closed on
Apr 4, 2006
Sold by
Kovalcik Peter C
Bought by
Coleman Floyd B
Home Financials for this Owner
Home Financials are based on the most recent Mortgage that was taken out on this home.
Original Mortgage
$117,472
Interest Rate
6.29%
Purchase Details
Closed on
Jan 3, 2002
Sold by
Martin David and Martin Ramon
Bought by
Kovalcik Peter C
Purchase Details
Closed on
Apr 29, 1993
Bought by
Martin David and Martin Ramon
Purchase Details
Closed on
Aug 20, 1992
Bought by
Winston Neesmith Con
Purchase Details
Closed on
Jan 8, 1988
Bought by
Krebs Paul B
Create a Home Valuation Report for This Property
The Home Valuation Report is an in-depth analysis detailing your home's value as well as a comparison with similar homes in the area
Home Values in the Area
Average Home Value in this Area
Purchase History
| Date | Buyer | Sale Price | Title Company |
|---|---|---|---|
| Jnt Home Rentals Corp | -- | -- | |
| Tingley James A | $76,000 | -- | |
| Sec Of Veterans Affairs | $101,350 | -- | |
| Jpmorgan Chase Bank National A | $101,350 | -- | |
| Coleman Floyd B | $115,000 | -- | |
| Kovalcik Peter C | $83,000 | -- | |
| Martin David | $72,500 | -- | |
| Winston Neesmith Con | $11,000 | -- | |
| Krebs Paul B | -- | -- |
Source: Public Records
Mortgage History
| Date | Status | Borrower | Loan Amount |
|---|---|---|---|
| Previous Owner | Coleman Floyd B | $117,472 |
Source: Public Records
Tax History Compared to Growth
Tax History
| Year | Tax Paid | Tax Assessment Tax Assessment Total Assessment is a certain percentage of the fair market value that is determined by local assessors to be the total taxable value of land and additions on the property. | Land | Improvement |
|---|---|---|---|---|
| 2024 | $3,439 | $69,978 | $14,000 | $55,978 |
| 2023 | $3,439 | $61,539 | $12,000 | $49,539 |
| 2022 | $2,137 | $45,776 | $8,000 | $37,776 |
| 2021 | $1,999 | $42,028 | $8,000 | $34,028 |
| 2020 | $1,956 | $40,736 | $8,000 | $32,736 |
| 2019 | $1,879 | $39,401 | $8,000 | $31,401 |
| 2018 | $1,804 | $38,022 | $8,000 | $30,022 |
| 2017 | $1,264 | $38,389 | $8,000 | $30,389 |
| 2016 | $1,752 | $38,755 | $8,000 | $30,755 |
| 2015 | $1,394 | $34,946 | $6,000 | $28,946 |
| 2014 | $1,394 | $47,299 | $9,200 | $38,099 |
| 2013 | -- | $43,707 | $8,000 | $35,707 |
Source: Public Records
Map
Nearby Homes
- 0 Willowbrook Dr Unit 152303
- 903 Canyon Ct
- 917 Malibu Dr
- 909 Drake Ct
- 904 Drake Ct
- The Barrington Plan at Tranquil South
- The Jackson Plan at Tranquil South
- The Screven Plan at Tranquil South
- The Anderson Plan at Tranquil South
- The Denmark Plan at Tranquil South
- The Melwood Plan at Tranquil South
- The Sunbury Plan at Tranquil South
- The Brunsen Plan at Tranquil South
- The Chatman Plan at Tranquil South
- The Screven - Covenant Plan at Tranquil South
- The Richland Plan at Tranquil South
- The Norman Plan at Tranquil South
- The Stafford Plan at Tranquil South
- The Arcadia Plan at Tranquil South
- 901 Pintail Ct
- 802 Malibu Dr
- 901 Willowbrook Dr
- 804 Malibu Dr
- 902 Willowbrook Dr
- 803 Malibu Dr
- 902 Malibu Dr
- 806 Malibu Dr
- 903 Willowbrook Dr
- 807 Malibu Dr
- 904 Willowbrook Dr
- 904 Malibu Dr
- 809 Malibu Dr
- 808 Malibu Dr
- 903 Malibu Dr
- 906 Malibu Dr Unit 50
- 906 Malibu Dr
- 906 Willowbrook Dr
- 905 Willowbrook Dr
- 811 Malibu Dr
- 810 Malibu Dr