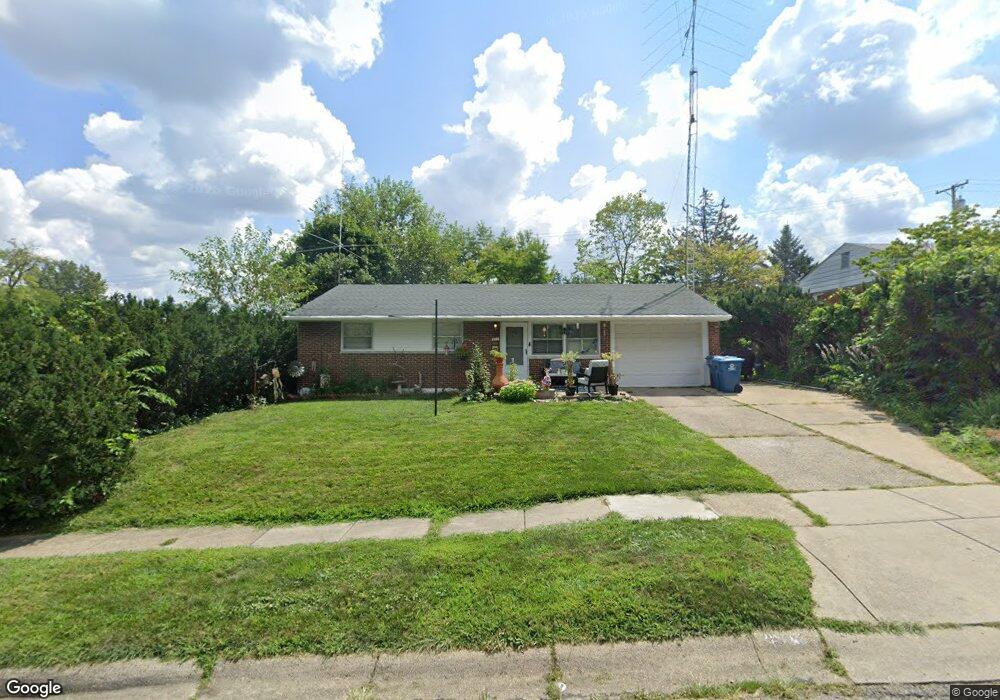
800 Wagon Wheel Dr Dayton, OH 45431
Estimated Value: $169,000 - $190,000
3
Beds
1
Bath
972
Sq Ft
$183/Sq Ft
Est. Value
About This Home
This home is located at 800 Wagon Wheel Dr, Dayton, OH 45431 and is currently estimated at $178,125, approximately $183 per square foot. 800 Wagon Wheel Dr is a home located in Montgomery County with nearby schools including Stebbins High School, St. Helen Elementary School, and East Dayton Christian School.
Ownership History
Date
Name
Owned For
Owner Type
Purchase Details
Closed on
Oct 21, 2021
Sold by
Owens Cristin M
Bought by
Stringer Chantel and West Curtis
Current Estimated Value
Home Financials for this Owner
Home Financials are based on the most recent Mortgage that was taken out on this home.
Original Mortgage
$132,554
Outstanding Balance
$121,017
Interest Rate
2.88%
Mortgage Type
FHA
Estimated Equity
$57,108
Purchase Details
Closed on
Nov 20, 2008
Sold by
Owens Limited Family Partnership
Bought by
Owens Cristin M
Purchase Details
Closed on
Apr 19, 2002
Sold by
Schneemann Eric and Schneemann Mary
Bought by
Owens Ltd Family Partnership
Purchase Details
Closed on
Jul 9, 2001
Sold by
Jones Griffith O
Bought by
Schneemann Eric and Schneemann Mary
Purchase Details
Closed on
Jun 30, 2001
Sold by
Jones Helen Ann
Bought by
Schneemann Eric and Schneemann Mary
Create a Home Valuation Report for This Property
The Home Valuation Report is an in-depth analysis detailing your home's value as well as a comparison with similar homes in the area
Home Values in the Area
Average Home Value in this Area
Purchase History
| Date | Buyer | Sale Price | Title Company |
|---|---|---|---|
| Stringer Chantel | $135,000 | Landmark Ttl Agcy South Inc | |
| Owens Cristin M | $55,000 | Attorney | |
| Owens Ltd Family Partnership | $63,100 | -- | |
| Schneemann Eric | $43,000 | -- | |
| Schneemann Eric | -- | -- |
Source: Public Records
Mortgage History
| Date | Status | Borrower | Loan Amount |
|---|---|---|---|
| Open | Stringer Chantel | $132,554 |
Source: Public Records
Tax History Compared to Growth
Tax History
| Year | Tax Paid | Tax Assessment Tax Assessment Total Assessment is a certain percentage of the fair market value that is determined by local assessors to be the total taxable value of land and additions on the property. | Land | Improvement |
|---|---|---|---|---|
| 2024 | $2,446 | $50,960 | $8,350 | $42,610 |
| 2023 | $2,446 | $50,960 | $8,350 | $42,610 |
| 2022 | $2,065 | $32,050 | $5,250 | $26,800 |
| 2021 | $2,104 | $32,050 | $5,250 | $26,800 |
| 2020 | $2,103 | $32,050 | $5,250 | $26,800 |
| 2019 | $1,983 | $26,920 | $5,250 | $21,670 |
| 2018 | $1,987 | $26,920 | $5,250 | $21,670 |
| 2017 | $1,986 | $26,920 | $5,250 | $21,670 |
| 2016 | $1,991 | $26,200 | $5,250 | $20,950 |
| 2015 | $2,116 | $26,200 | $5,250 | $20,950 |
| 2014 | $2,116 | $26,200 | $5,250 | $20,950 |
| 2012 | -- | $23,730 | $7,700 | $16,030 |
Source: Public Records
Map
Nearby Homes
- 5300 Duquesne Ave
- 4311 Richland Ave
- 4328 Richland Ave
- 5619 Candlelight Ln
- 420 Pardee Place
- 884 Crestmont Dr
- 484 Danforth Place
- 719 Cosler Dr
- 5664 Mayville Dr
- 372 Trunk Dr
- Lot 10 Linden Ave
- Lot 11 Linden Ave
- 601 Ostrander Dr
- 5588 Sharp Rd
- 1921 Emerald Ct
- 511 S Hayden Ave
- 456 S Hayden Ave
- 521 Pollock Rd
- 1195 Ringwalt Dr
- 1307 Cobblestone St
- 796 Wagon Wheel Dr
- 810 Wagon Wheel Dr
- 827 Woodhill Rd
- 837 Woodhill Rd
- 817 Woodhill Rd
- 822 Wagon Wheel Dr
- 5230 Underwood Rd
- 801 Wagon Wheel Dr
- 791 Wagon Wheel Dr
- 847 Woodhill Rd
- 5264 Underwood Rd
- 813 Wagon Wheel Dr
- 832 Wagon Wheel Dr
- 5200 Underwood Rd
- 825 Wagon Wheel Dr
- 857 Woodhill Rd
- 5229 Underwood Rd
- 826 Woodhill Rd
- 790 Harlan Place
- 837 Wagon Wheel Dr