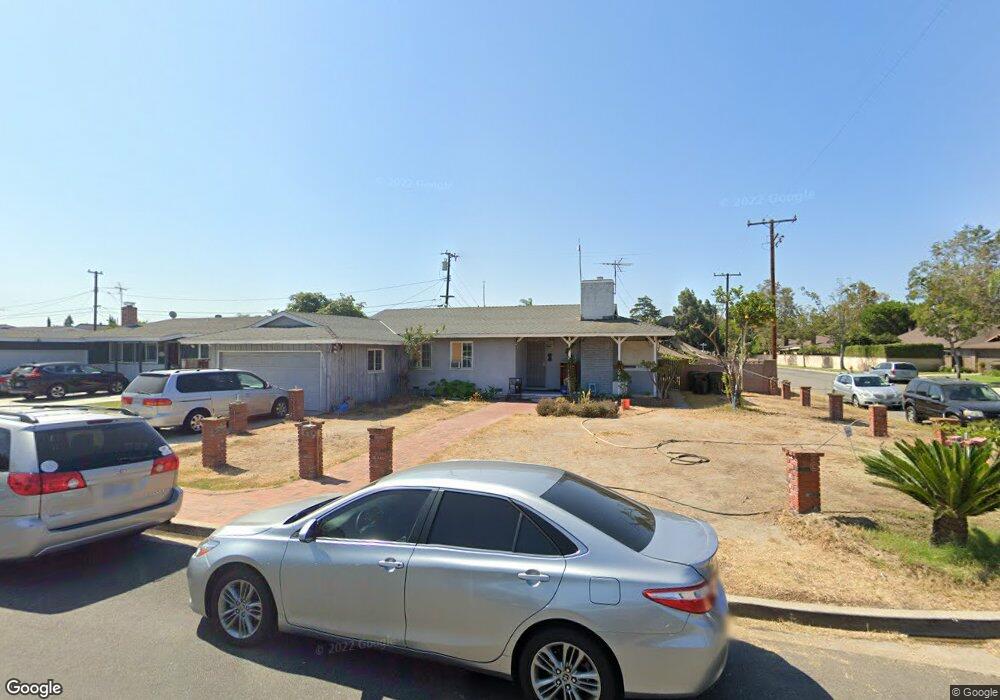
8002 Imperial Ave Garden Grove, CA 92844
Estimated Value: $897,150 - $1,041,000
4
Beds
2
Baths
1,347
Sq Ft
$714/Sq Ft
Est. Value
About This Home
This home is located at 8002 Imperial Ave, Garden Grove, CA 92844 and is currently estimated at $962,038, approximately $714 per square foot. 8002 Imperial Ave is a home located in Orange County with nearby schools including Meairs Elementary School, Warner Middle, and Westminster High School.
Ownership History
Date
Name
Owned For
Owner Type
Purchase Details
Closed on
Feb 19, 2003
Sold by
Bui Triet M
Bought by
Bui Triet M and Ha Lorna A
Current Estimated Value
Purchase Details
Closed on
Aug 29, 2002
Sold by
Ha Loan Anh
Bought by
Bui Triet M
Purchase Details
Closed on
Feb 25, 1999
Sold by
Bui Triet Minh
Bought by
Ha Laon Anh
Home Financials for this Owner
Home Financials are based on the most recent Mortgage that was taken out on this home.
Original Mortgage
$138,000
Outstanding Balance
$32,720
Interest Rate
6.76%
Estimated Equity
$929,318
Purchase Details
Closed on
Feb 22, 1999
Sold by
Thanh Truong Hai and Thanh Gia Dung
Bought by
Ha Loan Anh
Home Financials for this Owner
Home Financials are based on the most recent Mortgage that was taken out on this home.
Original Mortgage
$138,000
Outstanding Balance
$32,720
Interest Rate
6.76%
Estimated Equity
$929,318
Create a Home Valuation Report for This Property
The Home Valuation Report is an in-depth analysis detailing your home's value as well as a comparison with similar homes in the area
Home Values in the Area
Average Home Value in this Area
Purchase History
| Date | Buyer | Sale Price | Title Company |
|---|---|---|---|
| Bui Triet M | -- | -- | |
| Bui Triet M | -- | Commonwealth Land Title | |
| Ha Laon Anh | -- | Chicago Title Co | |
| Ha Loan Anh | $184,000 | Chicago Title Co |
Source: Public Records
Mortgage History
| Date | Status | Borrower | Loan Amount |
|---|---|---|---|
| Open | Ha Loan Anh | $138,000 |
Source: Public Records
Tax History Compared to Growth
Tax History
| Year | Tax Paid | Tax Assessment Tax Assessment Total Assessment is a certain percentage of the fair market value that is determined by local assessors to be the total taxable value of land and additions on the property. | Land | Improvement |
|---|---|---|---|---|
| 2025 | $3,804 | $288,447 | $208,031 | $80,416 |
| 2024 | $3,804 | $282,792 | $203,952 | $78,840 |
| 2023 | $3,679 | $277,248 | $199,953 | $77,295 |
| 2022 | $3,622 | $271,812 | $196,032 | $75,780 |
| 2021 | $3,695 | $266,483 | $192,188 | $74,295 |
| 2020 | $3,505 | $263,751 | $190,217 | $73,534 |
| 2019 | $3,465 | $258,580 | $186,487 | $72,093 |
| 2018 | $3,459 | $253,510 | $182,830 | $70,680 |
| 2017 | $3,334 | $248,540 | $179,245 | $69,295 |
| 2016 | $3,209 | $243,667 | $175,730 | $67,937 |
| 2015 | $3,154 | $240,007 | $173,090 | $66,917 |
| 2014 | $3,083 | $235,306 | $169,699 | $65,607 |
Source: Public Records
Map
Nearby Homes
- 13502 Jackson St
- 13141 Monroe St
- 8197 Jasmine Ave
- 7811 24th St
- 13532 Richardson Way
- 13082 Monroe St
- 12920 Sycamore St
- 13762 Pacific Ave
- 8442 Trask Ave
- 7565 23rd St
- 13252 Newland St Unit A-D
- 7603 23rd St
- 8051 Acacia Ave Unit 23
- 8520 Lake Knoll Ave Unit B
- 8569 Edgebrook Dr
- 8202 19th St
- 7891 18th St
- 13175 Creek View Dr Unit F
- 13911 Pacific Ave
- 12892 Adelle St
- 8012 Imperial Ave
- 8001 Bestel Ave
- 8011 Bestel Ave
- 13311 Coast St
- 8032 Imperial Ave
- 13301 Coast St
- 13321 Coast St
- 13291 Coast St
- 8001 Imperial Ave
- 13331 Coast St
- 8031 Bestel Ave
- 8011 Imperial Ave
- 13281 Coast St
- 13342 Beach Terrace Dr
- 8042 Imperial Ave
- 8031 Imperial Ave
- 13271 Coast St
- 13352 Beach Terrace Dr
- 13332 Beach Terrace Dr
- 8041 Bestel Ave