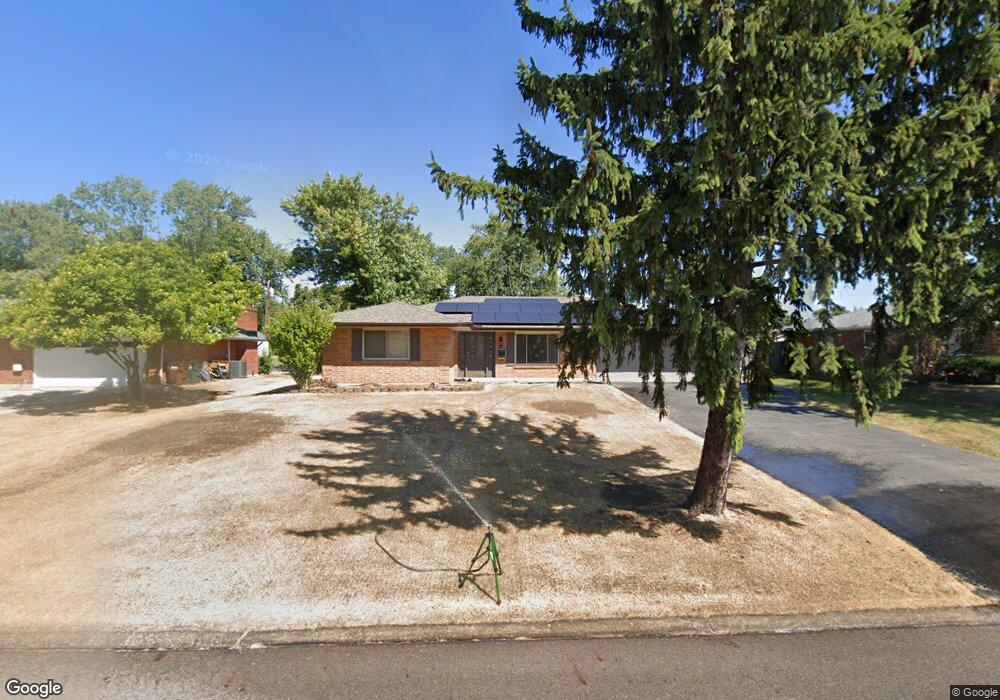
8007 Washington Park Dr Dayton, OH 45459
Woodbourne-Hyde Park NeighborhoodEstimated Value: $276,000 - $292,781
3
Beds
2
Baths
1,335
Sq Ft
$215/Sq Ft
Est. Value
About This Home
This home is located at 8007 Washington Park Dr, Dayton, OH 45459 and is currently estimated at $286,445, approximately $214 per square foot. 8007 Washington Park Dr is a home located in Montgomery County with nearby schools including Miamisburg High School, Bishop Leibold School, and Dayton Christian School.
Ownership History
Date
Name
Owned For
Owner Type
Purchase Details
Closed on
Aug 18, 2022
Sold by
Alhashinii Ashton
Bought by
Caraveo Jose and Caraveo Dawn
Current Estimated Value
Home Financials for this Owner
Home Financials are based on the most recent Mortgage that was taken out on this home.
Original Mortgage
$178,500
Outstanding Balance
$169,925
Interest Rate
4.99%
Mortgage Type
New Conventional
Estimated Equity
$116,520
Purchase Details
Closed on
Jun 4, 2022
Sold by
Alhashimi Natalie
Bought by
Alhashimi Ashton
Purchase Details
Closed on
Dec 15, 2021
Sold by
Alhashimi Ashton
Bought by
Alhashimi Natalie
Purchase Details
Closed on
Feb 23, 2015
Sold by
Stewart Patricia A
Bought by
Alhashimi Ashton
Home Financials for this Owner
Home Financials are based on the most recent Mortgage that was taken out on this home.
Original Mortgage
$89,540
Interest Rate
4.87%
Mortgage Type
FHA
Create a Home Valuation Report for This Property
The Home Valuation Report is an in-depth analysis detailing your home's value as well as a comparison with similar homes in the area
Home Values in the Area
Average Home Value in this Area
Purchase History
| Date | Buyer | Sale Price | Title Company |
|---|---|---|---|
| Caraveo Jose | $255,000 | None Listed On Document | |
| Alhashimi Ashton | -- | Stone Scot A | |
| Alhashimi Natalie | -- | None Available | |
| Alhashimi Ashton | $108,000 | Fidelity Lawyers Title Agenc |
Source: Public Records
Mortgage History
| Date | Status | Borrower | Loan Amount |
|---|---|---|---|
| Open | Caraveo Jose | $178,500 | |
| Previous Owner | Alhashimi Ashton | $89,540 |
Source: Public Records
Tax History Compared to Growth
Tax History
| Year | Tax Paid | Tax Assessment Tax Assessment Total Assessment is a certain percentage of the fair market value that is determined by local assessors to be the total taxable value of land and additions on the property. | Land | Improvement |
|---|---|---|---|---|
| 2024 | $6,540 | $93,620 | $9,100 | $84,520 |
| 2023 | $6,540 | $93,860 | $9,100 | $84,760 |
| 2022 | $4,327 | $51,540 | $6,740 | $44,800 |
| 2021 | $4,092 | $51,540 | $6,740 | $44,800 |
| 2020 | $4,029 | $51,540 | $6,740 | $44,800 |
| 2019 | $3,642 | $42,190 | $6,740 | $35,450 |
| 2018 | $3,617 | $42,190 | $6,740 | $35,450 |
| 2017 | $3,598 | $42,190 | $6,740 | $35,450 |
| 2016 | $3,255 | $36,560 | $6,740 | $29,820 |
| 2015 | $2,377 | $36,560 | $6,740 | $29,820 |
| 2014 | $2,377 | $36,560 | $6,740 | $29,820 |
| 2012 | -- | $38,040 | $10,680 | $27,360 |
Source: Public Records
Map
Nearby Homes
- 2334 Mardell Dr
- 2207 Southlea Dr
- 7806 Washington Park Dr
- 2560 Delavan Dr
- 1817 Provincetown Rd
- 1901 Washington Dr N
- 1943 Washington South Dr Unit 1943
- 488 Crossing Ln
- 550 Crossing Ln
- 3091 Simpson Ct
- 3057 Wellington Ln Unit 8264
- Yeats Plan at Chamberlin Crossing
- Turnbull Plan at Chamberlin Crossing
- 3052 Simpson Ct
- 3052 Simpson Ct Unit 8337
- 3091 Simpson Ct Unit 8355
- 488 Crossing Ln
- Remington Plan at Chamberlin Crossing
- 460 Crossing Ln
- Salinger Plan at Chamberlin Crossing
- 8001 Washington Park Dr
- 8013 Washington Park Dr
- 7985 Washington Park Dr
- 8019 Washington Park Dr
- 2312 Southlea Dr
- 2318 Southlea Dr
- 8000 Washington Park Dr
- 2324 Southlea Dr
- 7979 Washington Park Dr
- 8027 Washington Park Dr
- 8008 Washington Park Dr
- 8014 Washington Park Dr
- 2300 Southlea Dr
- 2330 Southlea Dr
- 8020 Washington Park Dr
- 7973 Washington Park Dr
- 8037 Washington Park Dr
- 7907 Kingsridge Dr
- 7978 Washington Park Dr
- 8026 Washington Park Dr