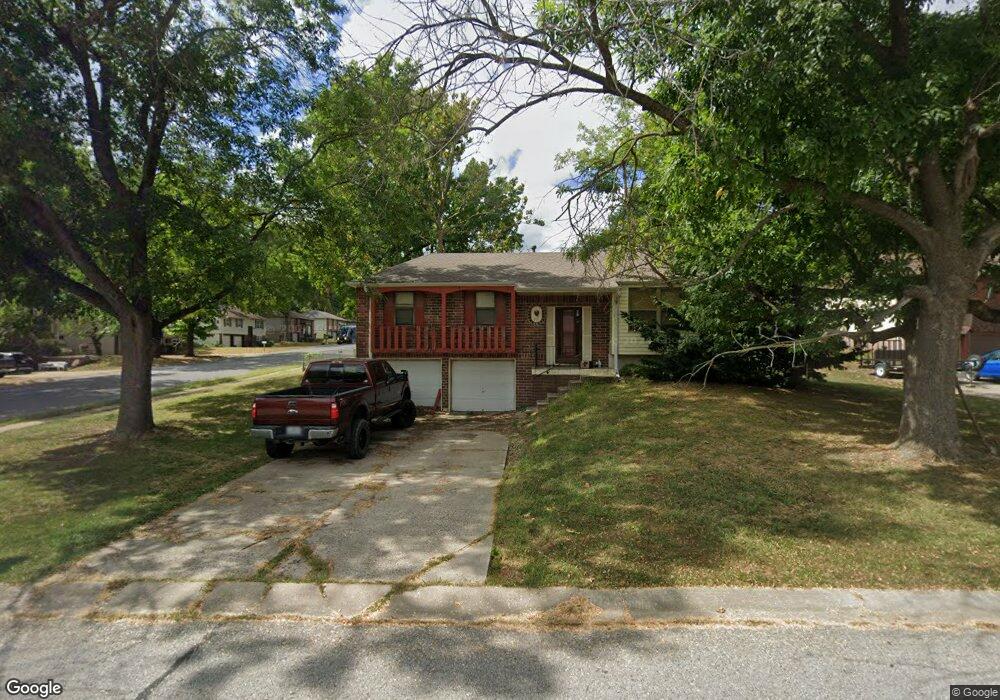
801 NW Kings Ct Blue Springs, MO 64015
Estimated Value: $230,000 - $253,000
3
Beds
2
Baths
1,170
Sq Ft
$211/Sq Ft
Est. Value
About This Home
This home is located at 801 NW Kings Ct, Blue Springs, MO 64015 and is currently estimated at $246,684, approximately $210 per square foot. 801 NW Kings Ct is a home located in Jackson County with nearby schools including James Lewis Elementary School, Brittany Hill Middle School, and Blue Springs High School.
Ownership History
Date
Name
Owned For
Owner Type
Purchase Details
Closed on
Dec 15, 2008
Sold by
Marshall Tadd and Marshall Amy
Bought by
Mills Clint R
Current Estimated Value
Home Financials for this Owner
Home Financials are based on the most recent Mortgage that was taken out on this home.
Original Mortgage
$96,379
Outstanding Balance
$63,526
Interest Rate
6.08%
Mortgage Type
FHA
Estimated Equity
$183,158
Purchase Details
Closed on
Dec 2, 2003
Sold by
Withrow West L Joyce
Bought by
Marshall Tadd and Marshall Amy
Purchase Details
Closed on
Mar 27, 1996
Sold by
Withrow West L Joyce and Withrow Letha Joyce
Bought by
Withrow West L Joyce
Home Financials for this Owner
Home Financials are based on the most recent Mortgage that was taken out on this home.
Original Mortgage
$56,000
Interest Rate
6.44%
Mortgage Type
Purchase Money Mortgage
Create a Home Valuation Report for This Property
The Home Valuation Report is an in-depth analysis detailing your home's value as well as a comparison with similar homes in the area
Home Values in the Area
Average Home Value in this Area
Purchase History
| Date | Buyer | Sale Price | Title Company |
|---|---|---|---|
| Mills Clint R | -- | Stewart Title Of Kansas City | |
| Marshall Tadd | -- | Security Land Title Company | |
| Withrow West L Joyce | -- | Ati Title Company |
Source: Public Records
Mortgage History
| Date | Status | Borrower | Loan Amount |
|---|---|---|---|
| Open | Mills Clint R | $96,379 | |
| Previous Owner | Withrow West L Joyce | $56,000 |
Source: Public Records
Tax History Compared to Growth
Tax History
| Year | Tax Paid | Tax Assessment Tax Assessment Total Assessment is a certain percentage of the fair market value that is determined by local assessors to be the total taxable value of land and additions on the property. | Land | Improvement |
|---|---|---|---|---|
| 2025 | $3,328 | $33,169 | $6,280 | $26,889 |
| 2024 | $3,264 | $40,795 | $6,046 | $34,749 |
| 2023 | $3,264 | $40,795 | $5,168 | $35,627 |
| 2022 | $2,271 | $25,080 | $5,425 | $19,655 |
| 2021 | $2,269 | $25,080 | $5,425 | $19,655 |
| 2020 | $2,026 | $22,782 | $5,425 | $17,357 |
| 2019 | $1,959 | $22,782 | $5,425 | $17,357 |
| 2018 | $893,207 | $22,081 | $3,660 | $18,421 |
| 2017 | $1,972 | $22,081 | $3,660 | $18,421 |
| 2016 | $1,918 | $21,527 | $3,116 | $18,411 |
| 2014 | $1,831 | $20,486 | $3,114 | $17,372 |
Source: Public Records
Map
Nearby Homes
- 2508 NW Castle Dr
- 2317 NW Kensington Ct
- 913 NW Camelot Ct
- 516 NW Mill Ct
- 2916 NW Chelsea Place
- 2804 NW Kingsridge Dr
- 1029 NW Berkshire Dr
- 3212 NW Canterbury Rd
- 3213 NW Canterbury Place
- 305 NW 17th St
- 124 SW 27th St
- 216 SW 26th St
- 1389 NW Jefferson Ct
- 503 NW 15th St
- 2000 SW Smith St
- 308 SW Woods Chapel Rd
- 1705 SW Walnut St
- 1400 NW Deer Run Trail
- 3012 SW Moore St
- 1109 NW B St
- 805 NW Kings Ct
- 2511 NW Castle Dr
- 809 NW Kings Ct
- 2512 NW Castle Dr
- 2504 NW Castle Dr
- 2516 NW Castle Dr
- 2501 NW Castle Dr
- 811 NW Kings Ct
- 804 NW Kings Ct
- 700 NW Camelot Place
- 808 NW Kings Ct
- 704 NW Camelot Place
- 2520 NW Castle Dr
- 2500 NW Castle Dr
- 708 NW Camelot Place
- 801 NW Castle Dr
- 804 NW Camelot Place
- 800 NW Camelot Place
- 808 NW Camelot Place
- 812 NW Camelot Place