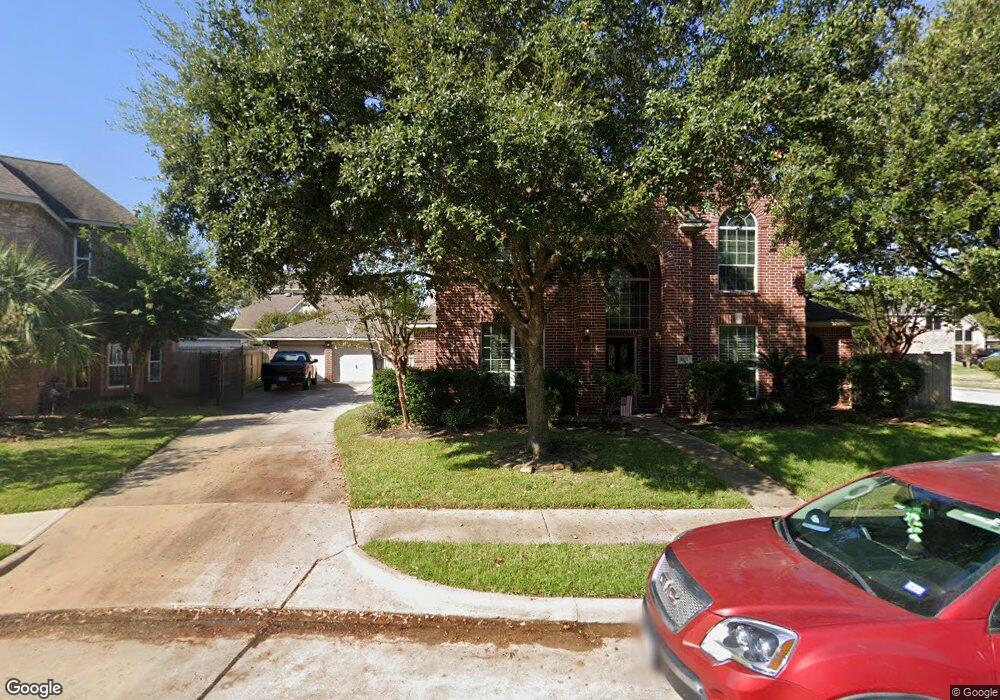
8011 Crescent Canyon Ct Houston, TX 77095
Copper Lakes NeighborhoodEstimated Value: $463,000 - $496,000
5
Beds
4
Baths
3,295
Sq Ft
$144/Sq Ft
Est. Value
About This Home
This home is located at 8011 Crescent Canyon Ct, Houston, TX 77095 and is currently estimated at $473,098, approximately $143 per square foot. 8011 Crescent Canyon Ct is a home located in Harris County with nearby schools including Copeland Elementary School, Aragon Middle School, and Langham Creek High School.
Ownership History
Date
Name
Owned For
Owner Type
Purchase Details
Closed on
May 29, 2015
Sold by
Kopech Carrie
Bought by
Flores Mario A and Flores Kirstin E
Current Estimated Value
Home Financials for this Owner
Home Financials are based on the most recent Mortgage that was taken out on this home.
Original Mortgage
$277,400
Outstanding Balance
$214,316
Interest Rate
3.68%
Mortgage Type
New Conventional
Estimated Equity
$258,782
Purchase Details
Closed on
Aug 28, 2001
Sold by
Partners In Building Lp
Bought by
Kopech Edward and Kopech Carrie
Home Financials for this Owner
Home Financials are based on the most recent Mortgage that was taken out on this home.
Original Mortgage
$39,409
Interest Rate
7.07%
Mortgage Type
Unknown
Purchase Details
Closed on
Jul 17, 2000
Sold by
Copper Lakes Development Lp
Bought by
Norwood Homes Of Texas Ltd
Home Financials for this Owner
Home Financials are based on the most recent Mortgage that was taken out on this home.
Original Mortgage
$154,770
Interest Rate
8.36%
Create a Home Valuation Report for This Property
The Home Valuation Report is an in-depth analysis detailing your home's value as well as a comparison with similar homes in the area
Home Values in the Area
Average Home Value in this Area
Purchase History
| Date | Buyer | Sale Price | Title Company |
|---|---|---|---|
| Flores Mario A | -- | First American Title | |
| Kopech Edward | -- | Texas American Title Company | |
| Norwood Homes Of Texas Ltd | -- | Texas American Title Company |
Source: Public Records
Mortgage History
| Date | Status | Borrower | Loan Amount |
|---|---|---|---|
| Open | Flores Mario A | $277,400 | |
| Previous Owner | Kopech Edward | $39,409 | |
| Previous Owner | Kopech Edward | $210,100 | |
| Previous Owner | Norwood Homes Of Texas Ltd | $154,770 |
Source: Public Records
Tax History Compared to Growth
Tax History
| Year | Tax Paid | Tax Assessment Tax Assessment Total Assessment is a certain percentage of the fair market value that is determined by local assessors to be the total taxable value of land and additions on the property. | Land | Improvement |
|---|---|---|---|---|
| 2025 | $7,468 | $461,137 | $80,250 | $380,887 |
| 2024 | $7,468 | $468,888 | $80,250 | $388,638 |
| 2023 | $7,468 | $522,548 | $80,250 | $442,298 |
| 2022 | $9,447 | $432,973 | $57,268 | $375,705 |
| 2021 | $9,102 | $356,451 | $57,268 | $299,183 |
| 2020 | $8,995 | $339,529 | $44,081 | $295,448 |
| 2019 | $9,610 | $351,919 | $44,081 | $307,838 |
| 2018 | $3,549 | $339,306 | $44,081 | $295,225 |
| 2017 | $9,420 | $339,306 | $44,081 | $295,225 |
| 2016 | $9,420 | $339,306 | $44,081 | $295,225 |
| 2015 | $6,718 | $339,306 | $44,081 | $295,225 |
| 2014 | $6,718 | $299,839 | $44,081 | $255,758 |
Source: Public Records
Map
Nearby Homes
- 17310 Crescent Canyon Dr
- 17518 Rustling Aspen Ln
- 17603 Fairgrove Park Dr
- 17710 Noble Oak Ct
- 8507 Forest Arbor Ct
- 7807 Hickory Mill Ct
- 8519 Sunrise Meadow Ln
- 17531 Cypress Laurel St
- 8410 Castle Pond Ct
- 7626 Almond Springs Dr
- 17814 Stoney Glade Ct
- 8311 Brighton Lake Ln
- 8410 Brighton Lake Ln
- 17214 Palm Falls Ct
- 8411 Sandestine Ct
- 8803 Emerald Shore Ct
- 7918 Blue Wahoo Ln
- 7838 Blue Wahoo Ln
- 17522 Masonridge Dr
- 17326 Masonridge Dr
- 8007 Crescent Canyon Ct
- 17426 W Mill Village Cir
- 17418 W Mill Village Cir
- 8003 Crescent Canyon Ct
- 17410 W Mill Village Cir
- 17406 Crescent Canyon Dr
- 17322 Crescent Canyon Dr
- 17410 Crescent Canyon Dr
- 8006 Crescent Canyon Ct
- 17402 W Mill Village Cir
- 8010 Crescent Canyon Ct
- 17414 Crescent Canyon Dr
- 17330 E Mill Village Cir
- 17318 Crescent Canyon Dr
- 17322 E Mill Village Cir
- 17419 W Mill Village Cir
- 17314 E Mill Village Cir
- 17418 Crescent Canyon Dr
- 17306 E Mill Village Cir
- 17415 W Mill Village Cir