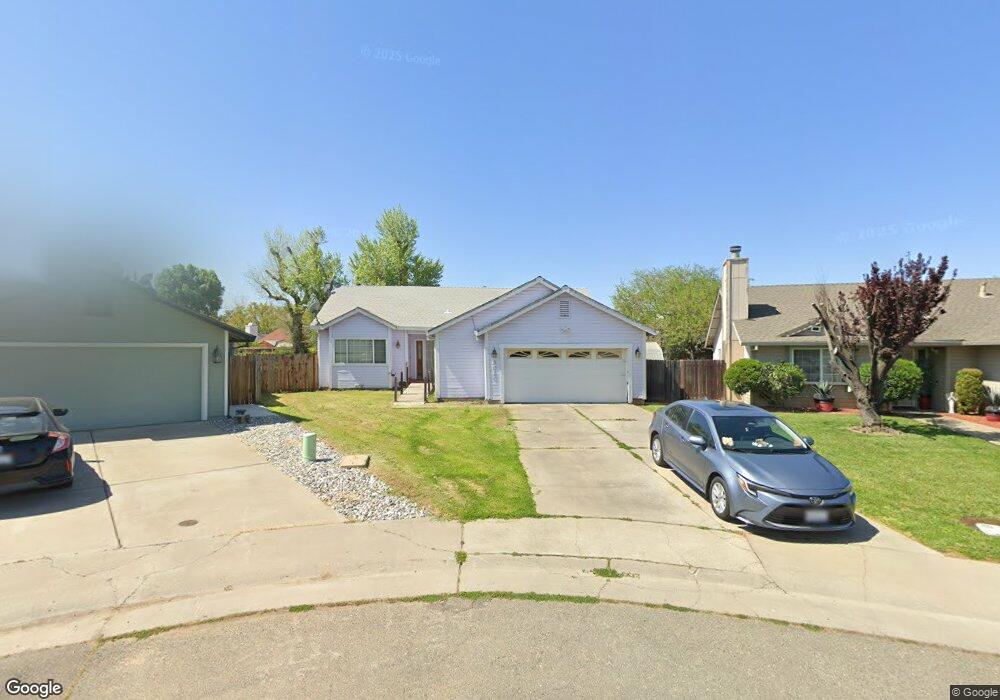
8020 Brightside Ct Sacramento, CA 95828
Estimated Value: $349,000 - $575,000
3
Beds
2
Baths
1,860
Sq Ft
$258/Sq Ft
Est. Value
About This Home
This home is located at 8020 Brightside Ct, Sacramento, CA 95828 and is currently estimated at $479,428, approximately $257 per square foot. 8020 Brightside Ct is a home located in Sacramento County with nearby schools including Isabelle Jackson Elementary School, James Rutter Middle School, and Florin High School.
Ownership History
Date
Name
Owned For
Owner Type
Purchase Details
Closed on
Apr 15, 2005
Sold by
On Cindy M and On Vinh C
Bought by
On Cindy M
Current Estimated Value
Home Financials for this Owner
Home Financials are based on the most recent Mortgage that was taken out on this home.
Original Mortgage
$254,800
Outstanding Balance
$140,079
Interest Rate
6.8%
Mortgage Type
New Conventional
Estimated Equity
$339,349
Purchase Details
Closed on
Apr 5, 2001
Sold by
Vong Jason A and On Cindy M
Bought by
On Cindy M
Home Financials for this Owner
Home Financials are based on the most recent Mortgage that was taken out on this home.
Original Mortgage
$160,225
Interest Rate
6.92%
Purchase Details
Closed on
Feb 10, 2000
Sold by
Vong Jason A
Bought by
Vong Jason A and On Cindy M
Purchase Details
Closed on
Nov 23, 1999
Sold by
Loper Lance D and Loper Katherine A
Bought by
Vong Jason A
Home Financials for this Owner
Home Financials are based on the most recent Mortgage that was taken out on this home.
Original Mortgage
$134,003
Interest Rate
7.84%
Mortgage Type
FHA
Create a Home Valuation Report for This Property
The Home Valuation Report is an in-depth analysis detailing your home's value as well as a comparison with similar homes in the area
Home Values in the Area
Average Home Value in this Area
Purchase History
| Date | Buyer | Sale Price | Title Company |
|---|---|---|---|
| On Cindy M | -- | Alliance Title Company | |
| On Cindy M | -- | Fidelity National Title | |
| Vong Jason A | -- | -- | |
| Vong Jason A | $135,000 | Fidelity National Title Co |
Source: Public Records
Mortgage History
| Date | Status | Borrower | Loan Amount |
|---|---|---|---|
| Open | On Cindy M | $254,800 | |
| Closed | On Cindy M | $160,225 | |
| Previous Owner | Vong Jason A | $134,003 |
Source: Public Records
Tax History Compared to Growth
Tax History
| Year | Tax Paid | Tax Assessment Tax Assessment Total Assessment is a certain percentage of the fair market value that is determined by local assessors to be the total taxable value of land and additions on the property. | Land | Improvement |
|---|---|---|---|---|
| 2025 | $4,483 | $257,644 | $45,191 | $212,453 |
| 2024 | $4,483 | $252,593 | $44,305 | $208,288 |
| 2023 | $4,381 | $247,641 | $43,437 | $204,204 |
| 2022 | $4,254 | $242,786 | $42,586 | $200,200 |
| 2021 | $4,134 | $238,026 | $41,751 | $196,275 |
| 2020 | $4,080 | $235,586 | $41,323 | $194,263 |
| 2019 | $4,031 | $230,967 | $40,513 | $190,454 |
| 2018 | $3,946 | $226,439 | $39,719 | $186,720 |
| 2017 | $3,882 | $222,000 | $38,941 | $183,059 |
| 2016 | $3,711 | $217,648 | $38,178 | $179,470 |
| 2015 | $3,627 | $214,380 | $37,605 | $176,775 |
| 2014 | $3,738 | $210,182 | $36,869 | $173,313 |
Source: Public Records
Map
Nearby Homes
- 8346 Floxtree Ct
- 8336 Cutler Way
- 8012 Northern Oak Cir
- 8336 Summer Sunset Dr
- 8266 Summer Sunset Dr
- 7905 Springarden Way
- 8282 Union Creek Way
- 8437 Yermo Way
- 8510 Cavendish Way
- 8186 Gustine Way
- 8077 Goran Ct
- 8317 Honeycomb Way
- 8205 Weyburn Ct
- 7855 Cottonwood Ln Unit 54
- 7855 Cottonwood Ln Unit 35
- 8016 Stevenson Ave
- 8233 Short Rd
- 4.13 ACR Lenhart Rd
- 7901 Stevenson Ave
- 8159 Morgan Hill Way
- 8024 Brightside Ct
- 8016 Brightside Ct
- 8041 Springarden Way
- 8025 Brightside Ct
- 8037 Springarden Way
- 8045 Springarden Way
- 8349 Stevenson Ave
- 8033 Springarden Way
- 8355 Stevenson Ave
- 8012 Brightside Ct
- 8021 Brightside Ct
- 8361 Stevenson Ave
- 8049 Springarden Way
- 8017 Brightside Ct
- 8029 Springarden Way
- 8013 Brightside Ct
- 8008 Brightside Ct
- 8365 Stevenson Ave
- 8009 Brightside Ct
- 8040 Springarden Way