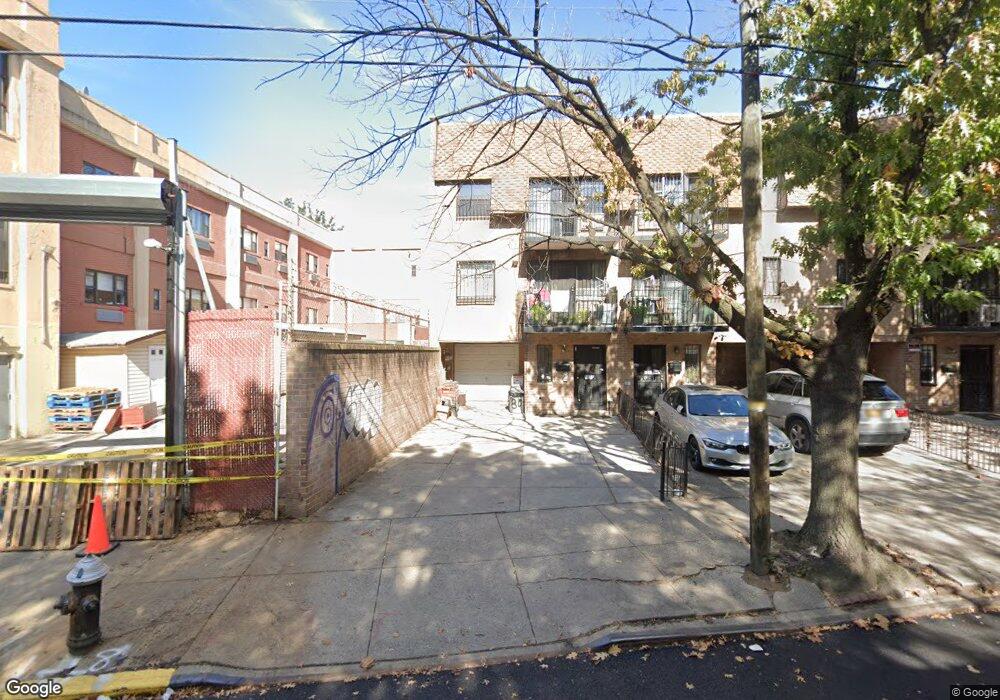
8029 47th Ave Elmhurst, NY 11373
Elmhurst NeighborhoodEstimated Value: $1,155,000 - $1,733,000
--
Bed
--
Bath
2,620
Sq Ft
$570/Sq Ft
Est. Value
About This Home
This home is located at 8029 47th Ave, Elmhurst, NY 11373 and is currently estimated at $1,494,667, approximately $570 per square foot. 8029 47th Ave is a home located in Queens County with nearby schools including P.S. 7 Louis F Simeone, Is 5 The Walter Crowley Intermediate School, and Newtown High School.
Ownership History
Date
Name
Owned For
Owner Type
Purchase Details
Closed on
Feb 3, 2020
Sold by
Lee Leung Ching and Lee Leung Yuk
Bought by
Leung Ching Lee Revocable Trust and Leung Ching Lee As Trustee
Current Estimated Value
Purchase Details
Closed on
Dec 14, 2004
Sold by
Lee Leung Yuk and Lee Leung Ching
Bought by
Leung Ching Lee Revocable Trust and Leung Ching Lee As Trustee
Purchase Details
Closed on
Jul 2, 2002
Sold by
Li Ching Wa and Lee Leung Ching
Bought by
Lee Leung Ching and Lee Leung Yuk
Home Financials for this Owner
Home Financials are based on the most recent Mortgage that was taken out on this home.
Original Mortgage
$340,000
Interest Rate
6.64%
Purchase Details
Closed on
Jun 30, 1995
Sold by
Li Yi Fuk and Lee Leung Ching
Bought by
Li Ching Was and Lee Leung Ching
Create a Home Valuation Report for This Property
The Home Valuation Report is an in-depth analysis detailing your home's value as well as a comparison with similar homes in the area
Home Values in the Area
Average Home Value in this Area
Purchase History
| Date | Buyer | Sale Price | Title Company |
|---|---|---|---|
| Leung Ching Lee Revocable Trust | -- | -- | |
| Leung Ching Lee Revocable Trust | -- | -- | |
| Leung Ching Lee Revocable Trust | -- | -- | |
| Leung Ching Lee Revocable Trust | -- | -- | |
| Lee Leung Ching | -- | -- | |
| Lee Leung Ching | -- | -- | |
| Li Ching Was | -- | -- | |
| Li Ching Was | -- | -- |
Source: Public Records
Mortgage History
| Date | Status | Borrower | Loan Amount |
|---|---|---|---|
| Previous Owner | Lee Leung Ching | $340,000 |
Source: Public Records
Tax History Compared to Growth
Tax History
| Year | Tax Paid | Tax Assessment Tax Assessment Total Assessment is a certain percentage of the fair market value that is determined by local assessors to be the total taxable value of land and additions on the property. | Land | Improvement |
|---|---|---|---|---|
| 2025 | $11,739 | $61,951 | $16,557 | $45,394 |
| 2024 | $11,739 | $58,445 | $15,505 | $42,940 |
| 2023 | $11,075 | $55,140 | $14,009 | $41,131 |
| 2022 | $11,008 | $89,340 | $21,600 | $67,740 |
| 2021 | $11,516 | $74,040 | $21,600 | $52,440 |
| 2020 | $10,928 | $81,180 | $21,600 | $59,580 |
| 2019 | $10,188 | $76,620 | $21,600 | $55,020 |
| 2018 | $9,367 | $45,950 | $15,402 | $30,548 |
| 2017 | $9,367 | $45,950 | $15,374 | $30,576 |
| 2016 | $9,116 | $45,950 | $15,374 | $30,576 |
| 2015 | $5,228 | $43,022 | $19,780 | $23,242 |
| 2014 | $5,228 | $40,587 | $18,922 | $21,665 |
Source: Public Records
Map
Nearby Homes
- 81-11 45th Ave Unit 3
- 4516 83rd St Unit W7C
- 4516 83rd St Unit E2D
- 4516 83rd St Unit E-8C
- 8111 45th Ave Unit 5K
- 45-11 82nd St Unit 2F
- 8006 47th Ave Unit 5A
- 80-06 47th Ave Unit 1E
- 4508 80th St Unit 3C
- 4607 79th St
- 79-01 45th Ave
- 0 Island Rd Unit S1604113
- 42-26 81st St Unit 4O
- 42-25 80th St Unit 2L
- 42-25 80th St Unit 1F
- 83-06 Vietor Ave Unit 2F
- 83-25 Vietor Ave Unit 1
- 4249 78th St
- 42-49 78th St
- 83-30 Vietor Ave Unit 417