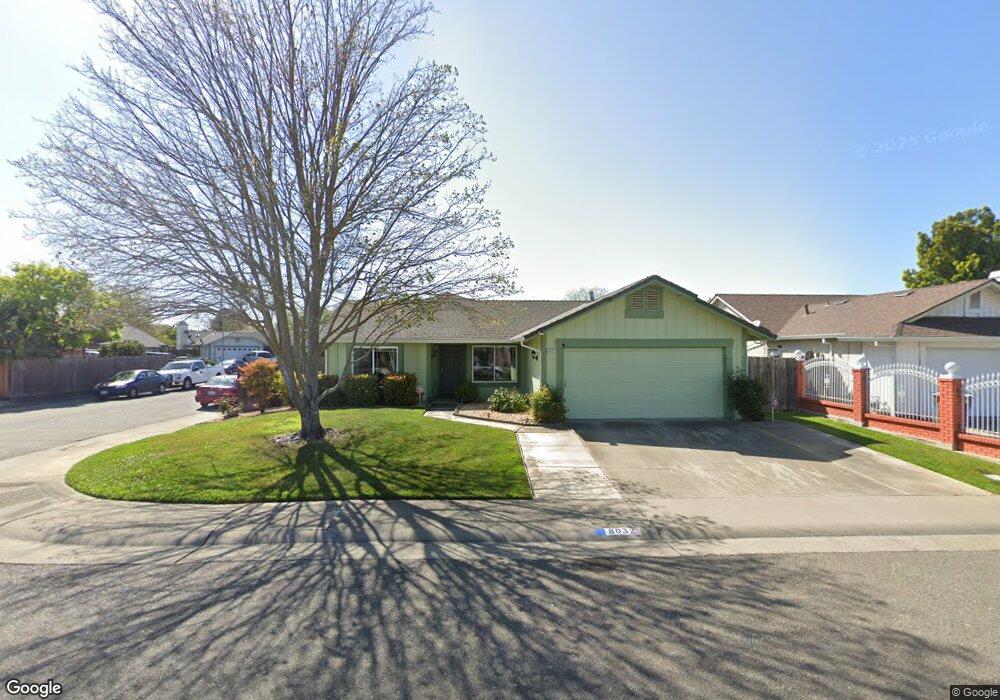
8032 Golden Meadow Dr Sacramento, CA 95828
Estimated Value: $387,000 - $501,000
4
Beds
2
Baths
1,468
Sq Ft
$315/Sq Ft
Est. Value
About This Home
This home is located at 8032 Golden Meadow Dr, Sacramento, CA 95828 and is currently estimated at $462,906, approximately $315 per square foot. 8032 Golden Meadow Dr is a home located in Sacramento County with nearby schools including Isabelle Jackson Elementary School, James Rutter Middle School, and Florin High School.
Ownership History
Date
Name
Owned For
Owner Type
Purchase Details
Closed on
May 26, 2005
Sold by
Heseman Larry H and Heseman Susan K
Bought by
Heseman Larry H and Heseman Susan K
Current Estimated Value
Home Financials for this Owner
Home Financials are based on the most recent Mortgage that was taken out on this home.
Original Mortgage
$84,000
Outstanding Balance
$42,033
Interest Rate
5.12%
Mortgage Type
Purchase Money Mortgage
Estimated Equity
$420,873
Purchase Details
Closed on
Dec 14, 1995
Sold by
American Svgs Bank
Bought by
Heseman Larry H and Heseman Susan K
Home Financials for this Owner
Home Financials are based on the most recent Mortgage that was taken out on this home.
Original Mortgage
$60,050
Interest Rate
7.38%
Purchase Details
Closed on
Aug 9, 1995
Sold by
Berger Daniel P and American Svgs Bank
Bought by
American Svgs Bank
Create a Home Valuation Report for This Property
The Home Valuation Report is an in-depth analysis detailing your home's value as well as a comparison with similar homes in the area
Home Values in the Area
Average Home Value in this Area
Purchase History
| Date | Buyer | Sale Price | Title Company |
|---|---|---|---|
| Heseman Larry H | -- | Chicago Title Co | |
| Heseman Larry H | $103,000 | Chicago Title Co | |
| American Svgs Bank | $84,957 | Old Republic Title Company |
Source: Public Records
Mortgage History
| Date | Status | Borrower | Loan Amount |
|---|---|---|---|
| Open | Heseman Larry H | $84,000 | |
| Closed | Heseman Larry H | $60,050 |
Source: Public Records
Tax History Compared to Growth
Tax History
| Year | Tax Paid | Tax Assessment Tax Assessment Total Assessment is a certain percentage of the fair market value that is determined by local assessors to be the total taxable value of land and additions on the property. | Land | Improvement |
|---|---|---|---|---|
| 2025 | $1,880 | $171,086 | $74,743 | $96,343 |
| 2024 | $1,880 | $167,732 | $73,278 | $94,454 |
| 2023 | $1,834 | $164,444 | $71,842 | $92,602 |
| 2022 | $1,803 | $161,221 | $70,434 | $90,787 |
| 2021 | $1,783 | $158,060 | $69,053 | $89,007 |
| 2020 | $1,759 | $156,440 | $68,345 | $88,095 |
| 2019 | $1,728 | $153,373 | $67,005 | $86,368 |
| 2018 | $1,683 | $150,367 | $65,692 | $84,675 |
| 2017 | $1,654 | $147,419 | $64,404 | $83,015 |
| 2016 | $1,574 | $144,530 | $63,142 | $81,388 |
| 2015 | $1,545 | $142,360 | $62,194 | $80,166 |
| 2014 | $1,520 | $139,572 | $60,976 | $78,596 |
Source: Public Records
Map
Nearby Homes
- 8346 Floxtree Ct
- 8012 Northern Oak Cir
- 8336 Cutler Way
- 8336 Summer Sunset Dr
- 8437 Yermo Way
- 8510 Cavendish Way
- 8266 Summer Sunset Dr
- 8282 Union Creek Way
- 7905 Springarden Way
- 8186 Gustine Way
- 8077 Goran Ct
- 8317 Honeycomb Way
- 7855 Cottonwood Ln Unit 54
- 7855 Cottonwood Ln Unit 35
- 8233 Short Rd
- 8205 Weyburn Ct
- 8159 Morgan Hill Way
- 8016 Stevenson Ave
- 8216 Exbourne Cir
- 4.13 ACR Lenhart Rd
- 8028 Golden Meadow Dr
- 8379 Country Glen Ct
- 8042 Golden Meadow Dr
- 8384 Bloomington Dr
- 8380 Bloomington Dr
- 8035 Golden Meadow Dr
- 8031 Golden Meadow Dr
- 8046 Golden Meadow Dr
- 8039 Golden Meadow Dr
- 8375 Country Glen Ct
- 8027 Golden Meadow Dr
- 8376 Country Glen Ct
- 8374 Bloomington Dr
- 8371 Country Glen Ct
- 8043 Golden Meadow Dr
- 8370 Country Glen Ct
- 8021 Golden Meadow Dr
- 8370 Bloomington Dr
- 8382 Dara Way
- 8389 Stevenson Ave