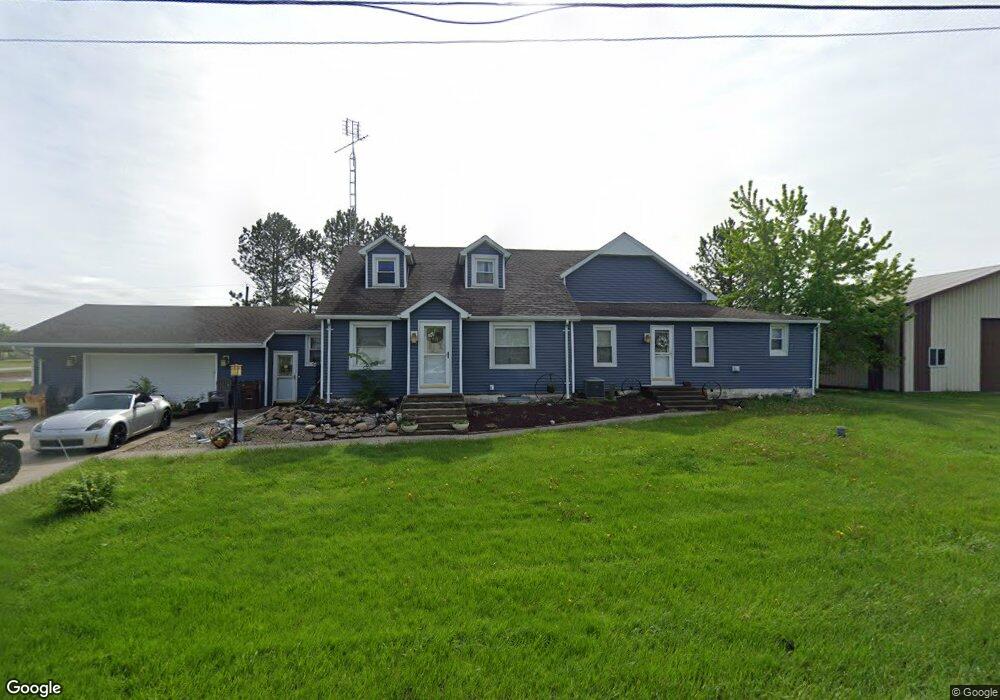
8033 Road 12 Ottawa, OH 45875
Estimated Value: $169,000 - $210,000
3
Beds
2
Baths
1,266
Sq Ft
$153/Sq Ft
Est. Value
About This Home
This home is located at 8033 Road 12, Ottawa, OH 45875 and is currently estimated at $193,822, approximately $153 per square foot. 8033 Road 12 is a home located in Putnam County with nearby schools including Ottawa-Glandorf High School and Sts. Peter & Paul Catholic School.
Ownership History
Date
Name
Owned For
Owner Type
Purchase Details
Closed on
Dec 15, 2017
Sold by
Meyer Grace E
Bought by
Newell Michele L and Newell Dwayne
Current Estimated Value
Home Financials for this Owner
Home Financials are based on the most recent Mortgage that was taken out on this home.
Original Mortgage
$73,952
Outstanding Balance
$51,916
Interest Rate
3.94%
Mortgage Type
New Conventional
Estimated Equity
$141,906
Purchase Details
Closed on
Jun 23, 2013
Sold by
Meyer Grace
Bought by
Newell Michelle and Newell Dwayne
Home Financials for this Owner
Home Financials are based on the most recent Mortgage that was taken out on this home.
Original Mortgage
$85,000
Interest Rate
4.5%
Mortgage Type
Seller Take Back
Purchase Details
Closed on
Mar 30, 2012
Sold by
Estate Of David E Meyer Sr
Bought by
Meyer Grace E
Create a Home Valuation Report for This Property
The Home Valuation Report is an in-depth analysis detailing your home's value as well as a comparison with similar homes in the area
Home Values in the Area
Average Home Value in this Area
Purchase History
| Date | Buyer | Sale Price | Title Company |
|---|---|---|---|
| Newell Michele L | $95,000 | None Available | |
| Newell Michelle | $95,000 | Attorney | |
| Meyer Grace E | -- | None Available |
Source: Public Records
Mortgage History
| Date | Status | Borrower | Loan Amount |
|---|---|---|---|
| Open | Newell Michele L | $73,952 | |
| Previous Owner | Newell Michelle | $85,000 |
Source: Public Records
Tax History Compared to Growth
Tax History
| Year | Tax Paid | Tax Assessment Tax Assessment Total Assessment is a certain percentage of the fair market value that is determined by local assessors to be the total taxable value of land and additions on the property. | Land | Improvement |
|---|---|---|---|---|
| 2024 | $1,480 | $47,370 | $5,670 | $41,700 |
| 2023 | $1,528 | $36,530 | $4,470 | $32,060 |
| 2022 | $1,343 | $36,530 | $4,470 | $32,060 |
| 2021 | $1,347 | $36,470 | $4,470 | $32,000 |
| 2020 | $1,355 | $27,530 | $4,000 | $23,530 |
| 2019 | $1,144 | $30,570 | $4,470 | $26,100 |
| 2018 | $1,122 | $30,570 | $4,470 | $26,100 |
| 2017 | $1,132 | $30,570 | $4,470 | $26,100 |
| 2016 | $963 | $27,530 | $4,000 | $23,530 |
| 2015 | $970 | $27,530 | $4,000 | $23,530 |
| 2014 | $956 | $27,530 | $4,000 | $23,530 |
| 2013 | $952 | $27,530 | $4,000 | $23,530 |
Source: Public Records
Map
Nearby Homes
- 13100 Ohio 613
- 12806 Road K
- #7 Oakview Dr
- #10 Oakview Dr
- #1 Oakview Dr
- #8 Oakview Dr
- #11 Oakview Dr
- #4 Oakview Dr
- #6 Oakview Dr
- #2 Oakview Dr
- #9 Oakview Dr
- 717 & 717 1/2 & 721 E Third St
- 304 Oakview (Unit E) Dr
- 715 N Perry St
- 530 N Taft Ave
- 443 E 4th St
- 4548 Road 13c
- 717 E 2nd St
- 8744 State Route 613
- 445 S Oak St