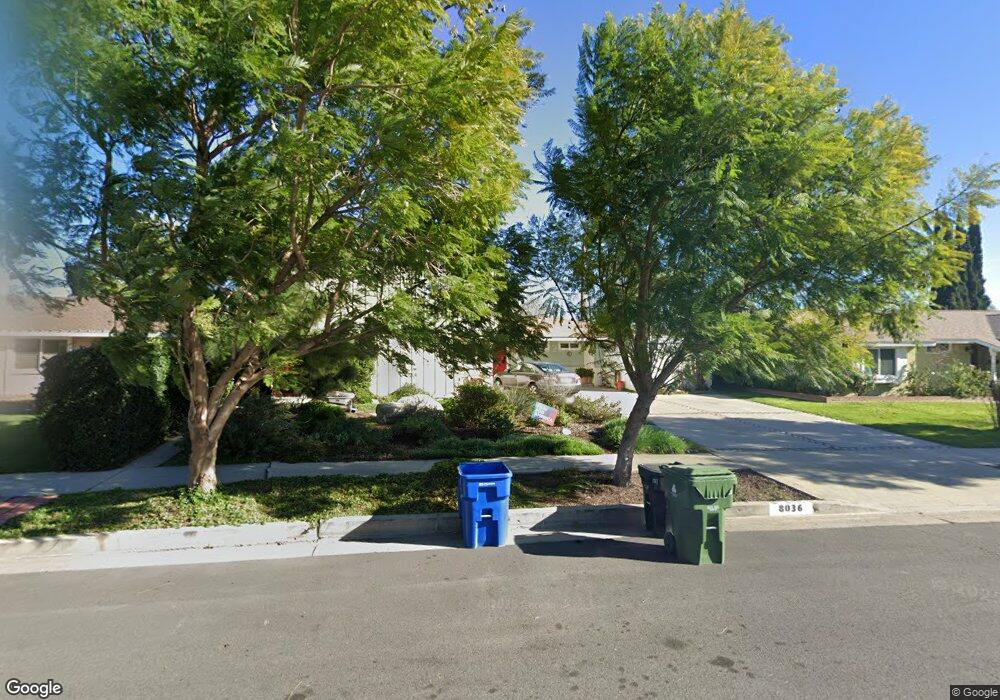
8036 Royer Ave Canoga Park, CA 91304
Canoga Park NeighborhoodEstimated Value: $932,939 - $1,039,000
3
Beds
3
Baths
1,944
Sq Ft
$503/Sq Ft
Est. Value
About This Home
This home is located at 8036 Royer Ave, Canoga Park, CA 91304 and is currently estimated at $977,735, approximately $502 per square foot. 8036 Royer Ave is a home located in Los Angeles County with nearby schools including Christopher Columbus Middle School, Canoga Park Senior High School, and Justice Street Academy Charter.
Ownership History
Date
Name
Owned For
Owner Type
Purchase Details
Closed on
Jun 25, 2002
Sold by
Ilger Paul and Ilger Rachel E
Bought by
Ilger E Rachel
Current Estimated Value
Home Financials for this Owner
Home Financials are based on the most recent Mortgage that was taken out on this home.
Original Mortgage
$224,000
Outstanding Balance
$93,070
Interest Rate
6.43%
Estimated Equity
$884,665
Purchase Details
Closed on
Jun 28, 2000
Sold by
Lindsey Debra E and Fischer Marlene
Bought by
Ilger Paul and Ilger Rachel E
Home Financials for this Owner
Home Financials are based on the most recent Mortgage that was taken out on this home.
Original Mortgage
$213,600
Interest Rate
4.95%
Purchase Details
Closed on
Oct 27, 1999
Sold by
Lindsey Mark W
Bought by
Lindsey Debra E and Fischer Marlene
Home Financials for this Owner
Home Financials are based on the most recent Mortgage that was taken out on this home.
Original Mortgage
$13,000
Interest Rate
7%
Mortgage Type
Seller Take Back
Create a Home Valuation Report for This Property
The Home Valuation Report is an in-depth analysis detailing your home's value as well as a comparison with similar homes in the area
Home Values in the Area
Average Home Value in this Area
Purchase History
| Date | Buyer | Sale Price | Title Company |
|---|---|---|---|
| Ilger E Rachel | -- | Lawyers Title | |
| Ilger Paul | $267,000 | South Coast Title | |
| Lindsey Debra E | -- | -- |
Source: Public Records
Mortgage History
| Date | Status | Borrower | Loan Amount |
|---|---|---|---|
| Open | Ilger E Rachel | $224,000 | |
| Closed | Ilger Paul | $213,600 | |
| Previous Owner | Lindsey Debra E | $13,000 |
Source: Public Records
Tax History Compared to Growth
Tax History
| Year | Tax Paid | Tax Assessment Tax Assessment Total Assessment is a certain percentage of the fair market value that is determined by local assessors to be the total taxable value of land and additions on the property. | Land | Improvement |
|---|---|---|---|---|
| 2025 | $5,064 | $402,303 | $241,834 | $160,469 |
| 2024 | $5,064 | $394,416 | $237,093 | $157,323 |
| 2023 | $4,970 | $386,684 | $232,445 | $154,239 |
| 2022 | $4,746 | $379,103 | $227,888 | $151,215 |
| 2021 | $4,680 | $371,670 | $223,420 | $148,250 |
| 2019 | $4,544 | $360,648 | $216,795 | $143,853 |
| 2018 | $4,427 | $353,578 | $212,545 | $141,033 |
| 2016 | $4,216 | $339,850 | $204,293 | $135,557 |
| 2015 | $4,156 | $334,746 | $201,225 | $133,521 |
| 2014 | $4,175 | $328,190 | $197,284 | $130,906 |
Source: Public Records
Map
Nearby Homes
- 8108 Royer Ave
- 7925 Royer Ave
- 22906 Lanark St
- 23200 Justice St
- 8225 Fallbrook Ave
- 8208 Fallbrook Ave
- 7729 Sedan Ave
- 22700 Baltar St
- 8373 Denise Ln
- 8324 Joan Ln
- 22715 Keswick St
- 7635 Fallbrook Ave
- 8404 Joan Ln
- 23025 Covello St
- 22836 Covello St
- 8456 Melba Ave
- 7831 Capistrano Ave
- 7957 Sausalito Ave
- 22824 W Olive Way
- 7845 Sausalito Ave
- 8030 Royer Ave
- 23011 Baltar St
- 8042 Royer Ave
- 8048 Royer Ave
- 23007 Baltar St
- 8037 Royer Ave
- 8031 Royer Ave
- 23030 Lanark St
- 23022 Baltar St
- 8045 Lena Ave
- 23026 Baltar St
- 23018 Baltar St
- 8053 Lena Ave
- 8039 Lena Ave
- 23001 Baltar St
- 8105 Lena Ave
- 23039 Baltar St
- 23038 Lanark St
- 23030 Baltar St
- 8031 Lena Ave