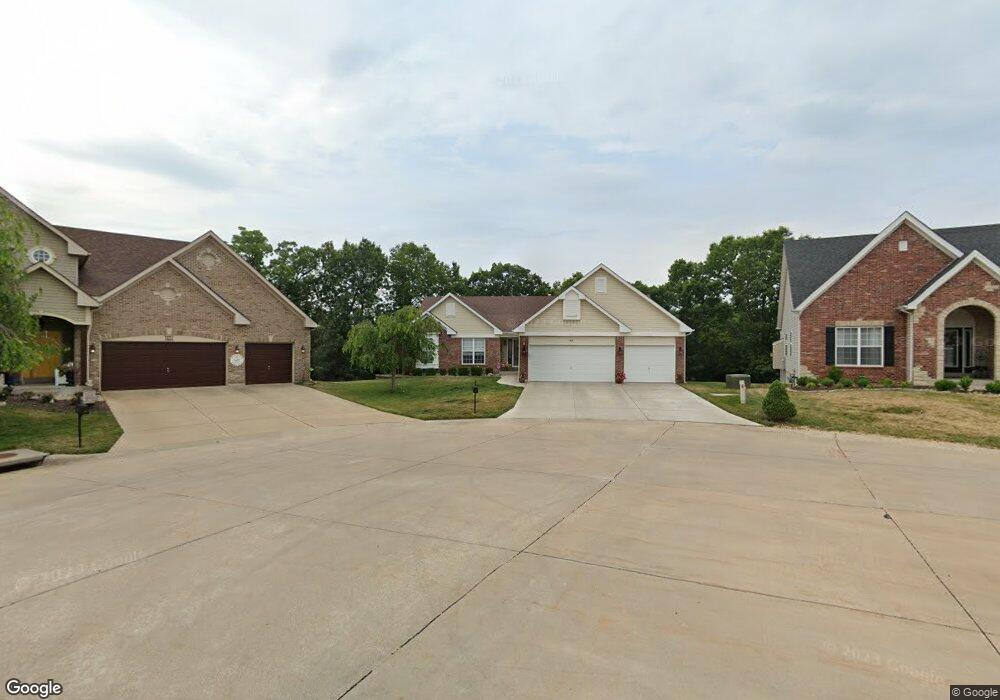
804 Highland Crossing High Ridge, MO 63049
Estimated Value: $361,969 - $435,000
--
Bed
--
Bath
2,162
Sq Ft
$182/Sq Ft
Est. Value
About This Home
This home is located at 804 Highland Crossing, High Ridge, MO 63049 and is currently estimated at $392,742, approximately $181 per square foot. 804 Highland Crossing is a home with nearby schools including Northwest High School.
Ownership History
Date
Name
Owned For
Owner Type
Purchase Details
Closed on
Feb 3, 2021
Sold by
Corey George and Corey Danelle
Bought by
George Corey And Danelle Corey Trust
Current Estimated Value
Purchase Details
Closed on
Jan 9, 2008
Sold by
Corey George D and Baumann Danelle L
Bought by
Corey George and Baumann Danelle
Home Financials for this Owner
Home Financials are based on the most recent Mortgage that was taken out on this home.
Original Mortgage
$255,458
Outstanding Balance
$161,108
Interest Rate
6.23%
Mortgage Type
Purchase Money Mortgage
Estimated Equity
$231,634
Purchase Details
Closed on
Dec 21, 2007
Sold by
American Heritage Homes Llc
Bought by
Corey George D and Baumann Danelle L
Home Financials for this Owner
Home Financials are based on the most recent Mortgage that was taken out on this home.
Original Mortgage
$255,458
Outstanding Balance
$161,108
Interest Rate
6.23%
Mortgage Type
Purchase Money Mortgage
Estimated Equity
$231,634
Create a Home Valuation Report for This Property
The Home Valuation Report is an in-depth analysis detailing your home's value as well as a comparison with similar homes in the area
Home Values in the Area
Average Home Value in this Area
Purchase History
| Date | Buyer | Sale Price | Title Company |
|---|---|---|---|
| George Corey And Danelle Corey Trust | -- | None Available | |
| Corey George | -- | Multiple | |
| Corey George D | -- | Heritage Land Title Co Llc |
Source: Public Records
Mortgage History
| Date | Status | Borrower | Loan Amount |
|---|---|---|---|
| Open | Corey George D | $255,458 |
Source: Public Records
Tax History Compared to Growth
Tax History
| Year | Tax Paid | Tax Assessment Tax Assessment Total Assessment is a certain percentage of the fair market value that is determined by local assessors to be the total taxable value of land and additions on the property. | Land | Improvement |
|---|---|---|---|---|
| 2025 | $3,791 | $57,400 | $7,700 | $49,700 |
| 2024 | $3,791 | $52,500 | $7,700 | $44,800 |
| 2023 | $3,791 | $52,500 | $7,700 | $44,800 |
| 2022 | $3,644 | $50,700 | $5,900 | $44,800 |
| 2021 | $3,622 | $50,700 | $5,900 | $44,800 |
| 2020 | $3,249 | $44,400 | $5,100 | $39,300 |
| 2019 | $3,245 | $44,400 | $5,100 | $39,300 |
| 2018 | $3,288 | $44,400 | $5,100 | $39,300 |
| 2017 | $3,005 | $44,400 | $5,100 | $39,300 |
| 2016 | $2,826 | $41,400 | $5,200 | $36,200 |
| 2015 | $2,904 | $41,400 | $5,200 | $36,200 |
| 2013 | -- | $41,100 | $5,200 | $35,900 |
Source: Public Records
Map
Nearby Homes
- 907 Palomino Path
- 2300 Appaloosa Trail
- 0 Mikel Ln
- 709 Heatherstone Dr
- 1516 Redbriar Dr
- 5012 Oak Bluff Dr
- 2132 Ridgedale Dr
- 2135 Linnus Dr
- 2149 Linnus Dr
- 0 Glick Rd Unit MIS25042566
- 1641 S Golden Cir
- 4856 E Golden Cir
- 168 Brandy Mill Cir Unit 5B
- 152 Brandy Mill Cir Unit 9G
- 1362 Hillsboro Rd
- 2436 Hillsboro Valley Park Rd
- 944 San Luis Dr
- 1524 Shalimar Ridge Ln
- 1275 Meadow Trail Ln
- 1201 Diamond Valley Dr
- 808 Highland Crossing
- 800 Highland Crossing
- 814 Highland Crossing
- 801 Highland Crossing
- 805 Highland Crossing
- 809 Highland Crossing
- 813 Highland Crossing
- 2109 Appaloosa Trail
- 2105 Appaloosa Trail
- 830 Highland Crossing
- 2101 Appaloosa Trail
- 2097 Appaloosa Trail
- 2089 Appaloosa Trail
- 2093 Appaloosa Trail
- 834 Highland Crossing
- 2114 Appaloosa Trail
- 2085 Appaloosa Trail
- 2110 Appaloosa Trail
- 2106 Appaloosa Trail
- 2081 Appaloosa Trail