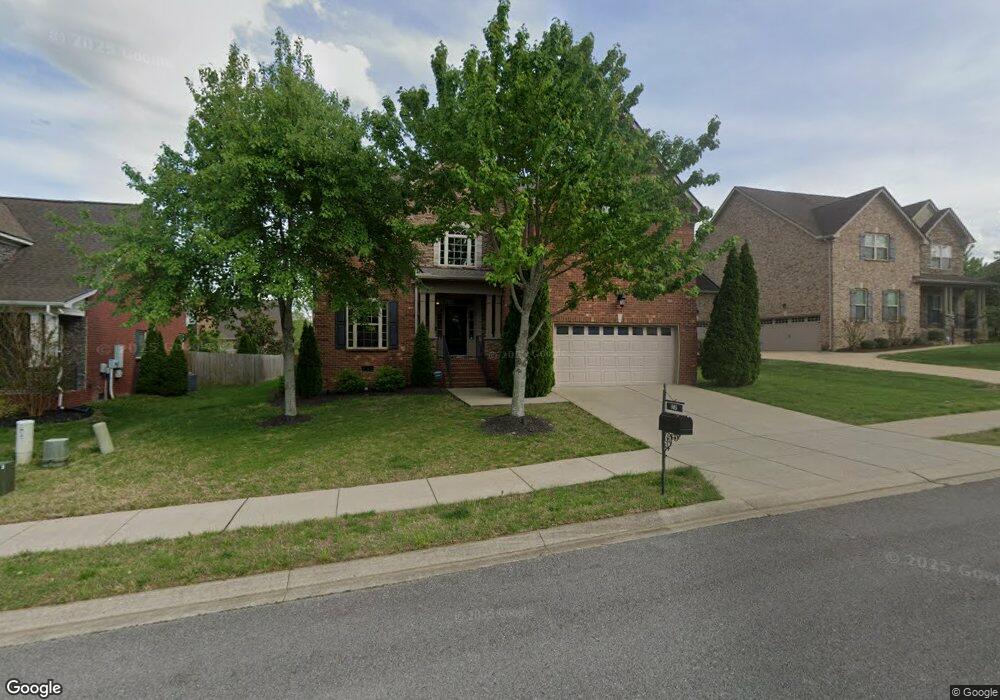
805 Fanning Ct Gallatin, TN 37066
Estimated Value: $554,745 - $621,000
3
Beds
3
Baths
2,541
Sq Ft
$229/Sq Ft
Est. Value
About This Home
This home is located at 805 Fanning Ct, Gallatin, TN 37066 and is currently estimated at $581,686, approximately $228 per square foot. 805 Fanning Ct is a home with nearby schools including Howard Elementary School, Rucker Stewart Middle School, and Station Camp High School.
Ownership History
Date
Name
Owned For
Owner Type
Purchase Details
Closed on
Apr 30, 2013
Sold by
Ole South Properties Inc
Bought by
Moore Chase M and Moore Lindsey N
Current Estimated Value
Home Financials for this Owner
Home Financials are based on the most recent Mortgage that was taken out on this home.
Original Mortgage
$165,750
Outstanding Balance
$118,030
Interest Rate
3.59%
Mortgage Type
Purchase Money Mortgage
Estimated Equity
$463,656
Purchase Details
Closed on
Jul 20, 2012
Sold by
Ole South Properties Inc
Bought by
Ole South Holdings Inc
Home Financials for this Owner
Home Financials are based on the most recent Mortgage that was taken out on this home.
Original Mortgage
$175,000
Interest Rate
3.68%
Mortgage Type
Construction
Purchase Details
Closed on
Oct 24, 2011
Sold by
B&J Enterprises
Bought by
Ole South Properties Inc
Purchase Details
Closed on
Sep 25, 2008
Sold by
B&J Enterprises
Bought by
Saddlebrook Homes Llc
Create a Home Valuation Report for This Property
The Home Valuation Report is an in-depth analysis detailing your home's value as well as a comparison with similar homes in the area
Home Values in the Area
Average Home Value in this Area
Purchase History
| Date | Buyer | Sale Price | Title Company |
|---|---|---|---|
| Moore Chase M | $265,000 | Tri Star Title & Escrow Llc | |
| Ole South Properties Inc | -- | Tri Star Title & Escrow Llc | |
| Ole South Holdings Inc | -- | None Available | |
| Ole South Properties Inc | $900,000 | None Available | |
| Saddlebrook Homes Llc | -- | Trustland Title & Escrow Llc |
Source: Public Records
Mortgage History
| Date | Status | Borrower | Loan Amount |
|---|---|---|---|
| Open | Ole South Properties Inc | $165,750 | |
| Open | Moore Chase M | $238,500 | |
| Previous Owner | Ole South Holdings Inc | $175,000 |
Source: Public Records
Tax History Compared to Growth
Tax History
| Year | Tax Paid | Tax Assessment Tax Assessment Total Assessment is a certain percentage of the fair market value that is determined by local assessors to be the total taxable value of land and additions on the property. | Land | Improvement |
|---|---|---|---|---|
| 2024 | $1,942 | $136,675 | $25,000 | $111,675 |
| 2023 | $2,595 | $85,050 | $15,025 | $70,025 |
| 2022 | $2,604 | $85,050 | $15,025 | $70,025 |
| 2021 | $2,604 | $85,050 | $15,025 | $70,025 |
| 2020 | $2,604 | $85,050 | $15,025 | $70,025 |
| 2019 | $2,604 | $0 | $0 | $0 |
| 2018 | $2,238 | $0 | $0 | $0 |
| 2017 | $2,238 | $0 | $0 | $0 |
| 2016 | $1,603 | $0 | $0 | $0 |
| 2015 | -- | $0 | $0 | $0 |
| 2014 | -- | $0 | $0 | $0 |
Source: Public Records
Map
Nearby Homes
- 806 Warrington Ct
- 156 Hackney Ln
- 638 Wassil Dr
- 376 Huntington Dr
- 292 Grassy Glen Dr
- 294 Buckingham Blvd
- 281 Grassy Glen Dr
- 415 Buckingham Blvd
- 420 Dorchester Place
- 808 Walpole Dr
- 139 Buckingham Blvd
- 810 Walpole Dr
- 3023 Duvall Dr
- 149 Putter Point Dr
- 1231 Wentworth Dr
- 1239 Wentworth Dr
- 559 Becks Place
- 608 Bradford Dr
- 1273 Wentworth Dr
- 1182 Long Hollow Pike Unit G3
- 809 Fanning Ct Unit 256
- 809 Fanning Ct
- 477 Goodman Drive Lot#28
- 801 Fanning Ct
- 806 Bauman Ct
- 806 Fanning Ct
- 802 Bauman Ct
- 810 Fanning Ct
- 810 Bauman Ct
- 802 Fanning Ct
- 813 Fanning Ct
- 814 Fanning Ct
- 369 Goodman Dr
- 814 Bauman Ct
- 367 Goodman Dr
- 805 Baggins Ct
- 809 Baggins Ct Unit 247
- 809 Baggins Ct
- 801 Baggins Ct
- 805 Bauman Ct