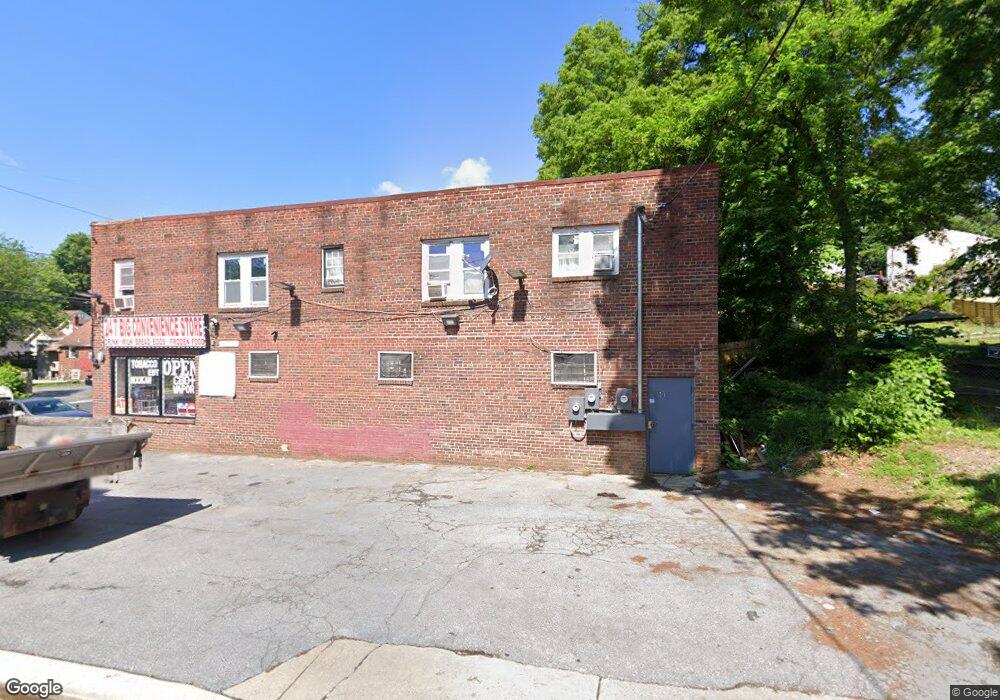
805 Larchmont Ave Capitol Heights, MD 20743
Estimated Value: $251,000 - $327,865
--
Bed
--
Bath
1,244
Sq Ft
$233/Sq Ft
Est. Value
About This Home
This home is located at 805 Larchmont Ave, Capitol Heights, MD 20743 and is currently estimated at $289,433, approximately $232 per square foot. 805 Larchmont Ave is a home located in Prince George's County with nearby schools including William W. Hall Academy, Central High School, and DC Scholars Public Charter School.
Ownership History
Date
Name
Owned For
Owner Type
Purchase Details
Closed on
Mar 22, 2013
Sold by
Greater Investment Llc
Bought by
Oh Chan Yung
Current Estimated Value
Purchase Details
Closed on
Oct 11, 2011
Sold by
Vhb Real Estate Llc
Bought by
Greater Investment Llc
Purchase Details
Closed on
Jul 22, 2011
Sold by
Vhb Real Estate Llc
Bought by
Greater Investment Llc
Purchase Details
Closed on
Jul 7, 2011
Sold by
Oh Tae S and Oh Jang Yong
Bought by
Vhb Real Estate Llc
Purchase Details
Closed on
Aug 23, 2001
Sold by
Yi Ho and Yi Hee S
Bought by
Oh Tae S and Oh Jang Y
Create a Home Valuation Report for This Property
The Home Valuation Report is an in-depth analysis detailing your home's value as well as a comparison with similar homes in the area
Home Values in the Area
Average Home Value in this Area
Purchase History
| Date | Buyer | Sale Price | Title Company |
|---|---|---|---|
| Oh Chan Yung | $150,000 | Fidelity Natl Title Ins Co | |
| Greater Investment Llc | $135,000 | -- | |
| Greater Investment Llc | $135,000 | None Available | |
| Greater Investment Llc | $135,000 | -- | |
| Vhb Real Estate Llc | $150,000 | None Available | |
| Oh Tae S | $175,000 | -- |
Source: Public Records
Tax History Compared to Growth
Tax History
| Year | Tax Paid | Tax Assessment Tax Assessment Total Assessment is a certain percentage of the fair market value that is determined by local assessors to be the total taxable value of land and additions on the property. | Land | Improvement |
|---|---|---|---|---|
| 2025 | $5,622 | $463,333 | -- | -- |
| 2024 | $5,622 | $367,667 | $0 | $0 |
| 2023 | $4,198 | $272,000 | $60,000 | $212,000 |
| 2022 | $2,967 | $266,833 | $0 | $0 |
| 2021 | $8,242 | $261,667 | $0 | $0 |
| 2020 | $7,935 | $256,500 | $60,000 | $196,500 |
| 2019 | $3,403 | $255,000 | $0 | $0 |
| 2018 | $4,471 | $253,500 | $0 | $0 |
| 2017 | $4,448 | $252,000 | $0 | $0 |
| 2016 | -- | $252,000 | $0 | $0 |
| 2015 | $4,395 | $252,000 | $0 | $0 |
| 2014 | $4,395 | $274,600 | $0 | $0 |
Source: Public Records
Map
Nearby Homes