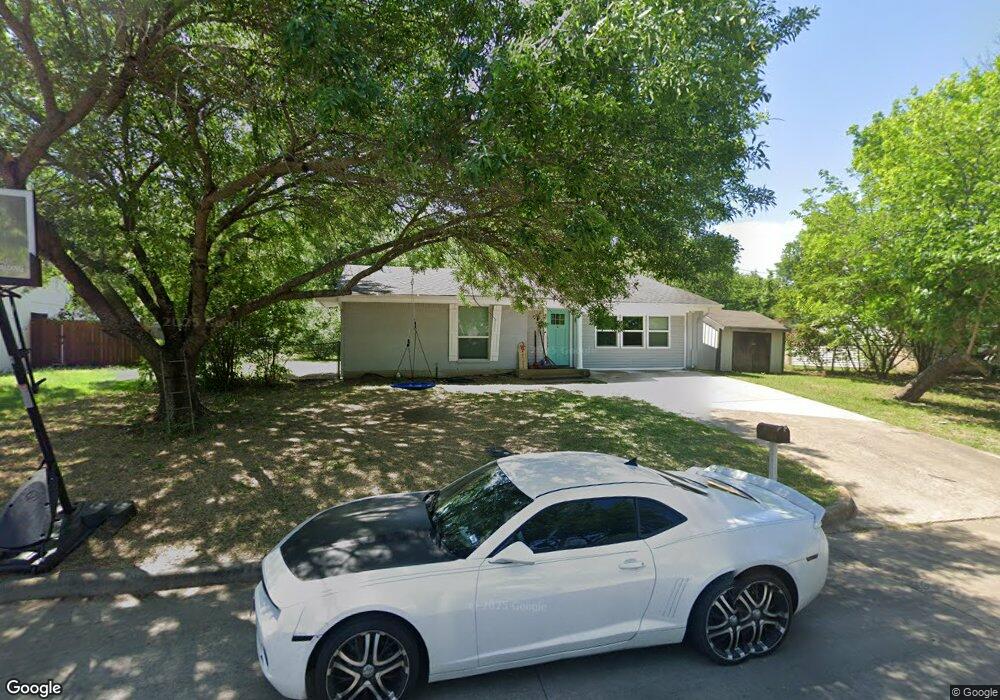
806 Crockett St Midlothian, TX 76065
Estimated Value: $257,891 - $291,000
3
Beds
4
Baths
1,449
Sq Ft
$189/Sq Ft
Est. Value
About This Home
This home is located at 806 Crockett St, Midlothian, TX 76065 and is currently estimated at $274,446, approximately $189 per square foot. 806 Crockett St is a home located in Ellis County with nearby schools including Irvin Elementary School and Frank Seale Middle School.
Ownership History
Date
Name
Owned For
Owner Type
Purchase Details
Closed on
Feb 3, 2024
Sold by
Red Top Homes Llc
Bought by
Rt Holdings Llc
Current Estimated Value
Purchase Details
Closed on
Jun 15, 2020
Sold by
Red Top Homes Llc
Bought by
Robinson Jeffrey Scott
Home Financials for this Owner
Home Financials are based on the most recent Mortgage that was taken out on this home.
Original Mortgage
$127,500
Interest Rate
2.9%
Mortgage Type
New Conventional
Purchase Details
Closed on
Mar 16, 2020
Sold by
Garcia Deena
Bought by
Red Top Homes Llc
Home Financials for this Owner
Home Financials are based on the most recent Mortgage that was taken out on this home.
Original Mortgage
$123,000
Interest Rate
3.4%
Mortgage Type
Commercial
Purchase Details
Closed on
Sep 20, 2005
Sold by
Omega Kathy L
Bought by
Sarcia Jascia
Create a Home Valuation Report for This Property
The Home Valuation Report is an in-depth analysis detailing your home's value as well as a comparison with similar homes in the area
Home Values in the Area
Average Home Value in this Area
Purchase History
| Date | Buyer | Sale Price | Title Company |
|---|---|---|---|
| Rt Holdings Llc | -- | None Listed On Document | |
| Robinson Jeffrey Scott | -- | Lawyers Title | |
| Red Top Homes Llc | -- | None Available | |
| Sarcia Jascia | -- | None Available |
Source: Public Records
Mortgage History
| Date | Status | Borrower | Loan Amount |
|---|---|---|---|
| Previous Owner | Robinson Jeffrey Scott | $127,500 | |
| Previous Owner | Red Top Homes Llc | $123,000 |
Source: Public Records
Tax History Compared to Growth
Tax History
| Year | Tax Paid | Tax Assessment Tax Assessment Total Assessment is a certain percentage of the fair market value that is determined by local assessors to be the total taxable value of land and additions on the property. | Land | Improvement |
|---|---|---|---|---|
| 2025 | $4,181 | $246,086 | $90,000 | $156,086 |
| 2024 | $4,181 | $207,235 | $90,000 | $117,235 |
| 2023 | $4,181 | $205,105 | $80,000 | $125,105 |
| 2022 | $3,320 | $148,171 | $45,000 | $103,171 |
| 2021 | $3,037 | $128,340 | $33,750 | $94,590 |
| 2020 | $2,964 | $117,830 | $33,750 | $84,080 |
| 2019 | $2,299 | $87,770 | $0 | $0 |
| 2018 | $1,213 | $86,320 | $20,000 | $66,320 |
| 2017 | $2,107 | $79,140 | $20,000 | $59,140 |
| 2016 | $1,917 | $72,010 | $15,000 | $57,010 |
| 2015 | $1,367 | $65,680 | $15,000 | $50,680 |
| 2014 | $1,367 | $64,600 | $0 | $0 |
Source: Public Records
Map
Nearby Homes
- 807 Crockett St
- 912 Crockett St
- 714 Green Acres Ln
- TBD 1 acre Overlook Dr
- 796 N 7th St
- 620 N 6th St
- 312 Overlook Dr
- 1105 Crooked Creek Ct
- 000 N 6th St
- 1834 Rough Ridge Trail
- 0 U S Highway 67
- 501 N 9th St
- 2281 Key Way
- 810 Bolivar Dr
- 809 Deleon Dr
- 1309 Rye Glen Dr
- 114 S 6th St
- 1410 Rye Glen Dr
- TBD Bryant Ave
- 536 N Bryant Ave
- 808 Crockett St
- 804 Crockett St
- 802 Crockett St
- 809 Crockett St
- 805 Crockett St
- 900 Crockett St
- 608 N 1st St
- 803 Crockett St
- 902 Crockett St
- 800 Crockett St
- 606 N 1st St
- 806 Bowie Dr
- 808 Bowie Dr
- 904 Crockett St
- 804 Bowie Dr
- 801 Crockett St
- 604 N 1st St
- 802 Bowie Dr
- 906 Crockett St
- 801 Green Acres Ln