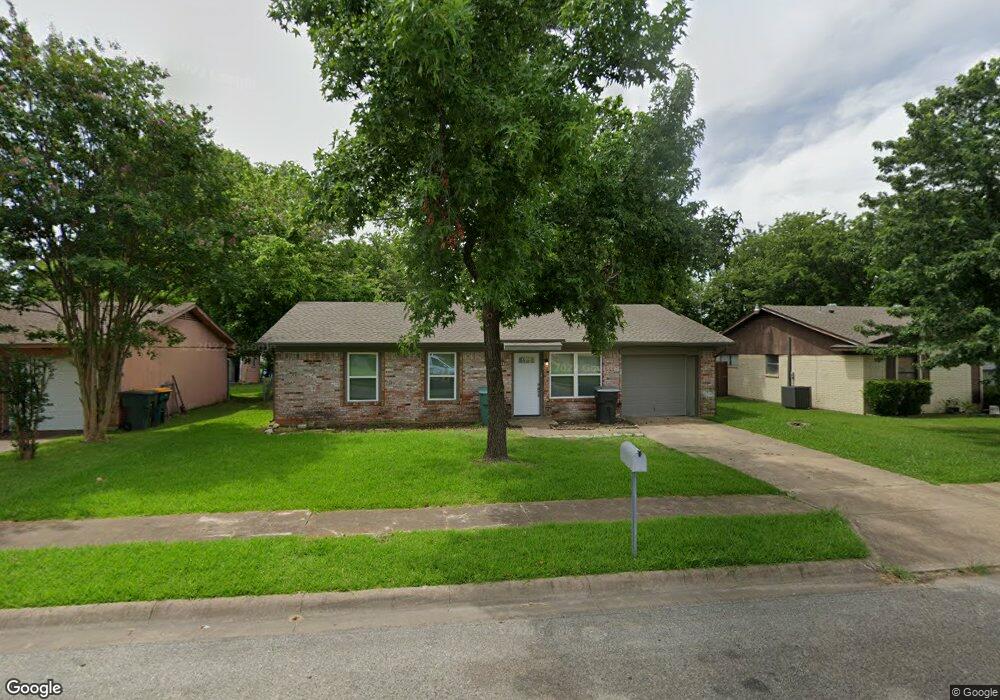
806 E Martin Ln Sherman, TX 75090
Estimated Value: $158,500 - $183,000
--
Bed
--
Bath
1,057
Sq Ft
$162/Sq Ft
Est. Value
About This Home
This home is located at 806 E Martin Ln, Sherman, TX 75090 and is currently estimated at $170,750, approximately $161 per square foot. 806 E Martin Ln is a home located in Grayson County with nearby schools including Washington Elementary School, Piner Middle School, and Dillingham Intermediate School.
Ownership History
Date
Name
Owned For
Owner Type
Purchase Details
Closed on
Jan 27, 2023
Sold by
Evolution Realty Llc
Bought by
Real Income Properties Texas I Llc
Current Estimated Value
Purchase Details
Closed on
Mar 9, 2022
Sold by
Daniel Cervantes
Bought by
Evolution Realty Llc
Home Financials for this Owner
Home Financials are based on the most recent Mortgage that was taken out on this home.
Original Mortgage
$130,000
Interest Rate
3.92%
Mortgage Type
New Conventional
Purchase Details
Closed on
Apr 21, 2017
Sold by
Cervantes Dolores A
Bought by
Cervantes Daniel
Create a Home Valuation Report for This Property
The Home Valuation Report is an in-depth analysis detailing your home's value as well as a comparison with similar homes in the area
Home Values in the Area
Average Home Value in this Area
Purchase History
| Date | Buyer | Sale Price | Title Company |
|---|---|---|---|
| Real Income Properties Texas I Llc | -- | Kane Title | |
| Evolution Realty Llc | -- | Red River Title | |
| Cervantes Daniel | -- | None Available |
Source: Public Records
Mortgage History
| Date | Status | Borrower | Loan Amount |
|---|---|---|---|
| Previous Owner | Evolution Realty Llc | $130,000 |
Source: Public Records
Tax History Compared to Growth
Tax History
| Year | Tax Paid | Tax Assessment Tax Assessment Total Assessment is a certain percentage of the fair market value that is determined by local assessors to be the total taxable value of land and additions on the property. | Land | Improvement |
|---|---|---|---|---|
| 2025 | $3,143 | $144,832 | $56,382 | $88,450 |
| 2024 | $3,143 | $143,315 | $48,452 | $94,863 |
| 2023 | $3,242 | $147,679 | $44,012 | $103,667 |
| 2022 | $3,651 | $155,767 | $45,835 | $109,932 |
| 2021 | $2,021 | $102,818 | $28,152 | $74,666 |
| 2020 | $1,924 | $73,319 | $16,574 | $56,745 |
| 2019 | $1,834 | $68,035 | $10,150 | $57,885 |
| 2018 | $1,621 | $65,027 | $9,675 | $55,352 |
| 2017 | $1,462 | $58,741 | $10,230 | $48,511 |
| 2016 | $1,534 | $61,609 | $3,648 | $57,961 |
| 2015 | $0 | $56,105 | $3,648 | $52,457 |
| 2014 | -- | $54,162 | $3,648 | $50,514 |
Source: Public Records
Map
Nearby Homes
- TBD S 1st St
- 805 E Summit St
- 609 E Centennial St
- 1110 E Summit St
- 1400 S Gribble St
- 915 E Spring St
- 1220 S Branch St
- TBD E Lake Ave
- 1323 S Montgomery St
- 000 S Branch St
- TBD Branch St
- 1219 S Montgomery St
- 609 E Epstein St
- TBD S East St
- 419 S Montgomery St
- 908 S Throckmorton St
- 603 E Thomas St
- 1326 S Walnut St
- 808 S Hazelwood St
- 805 S Hazelwood St