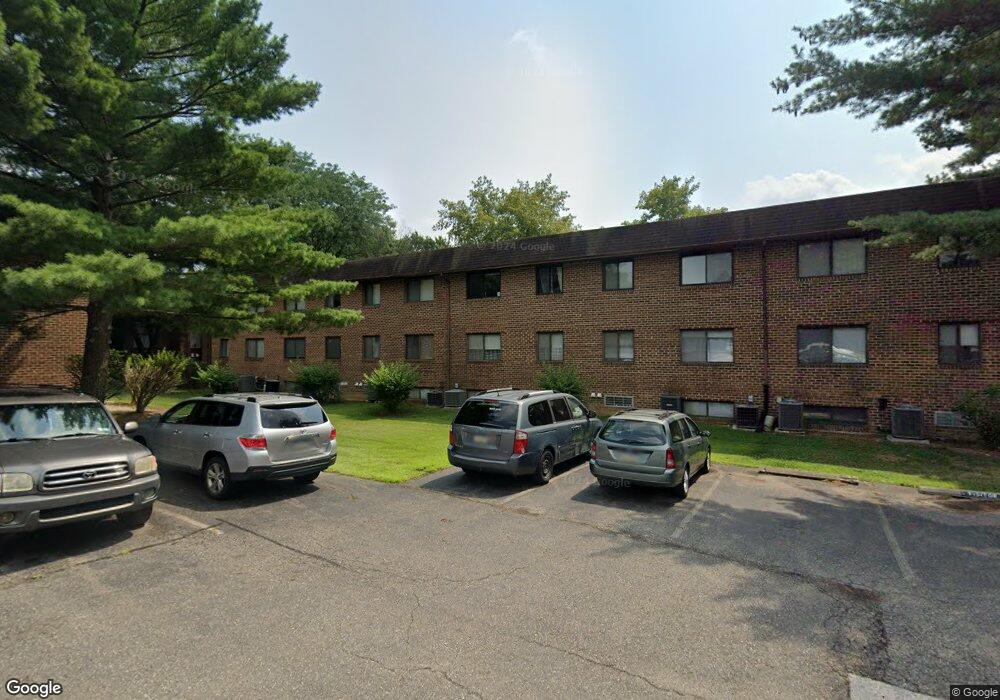
806 Putnam Blvd Unit 42A Wallingford, PA 19086
Estimated Value: $206,000 - $225,000
2
Beds
1
Bath
889
Sq Ft
$243/Sq Ft
Est. Value
About This Home
This home is located at 806 Putnam Blvd Unit 42A, Wallingford, PA 19086 and is currently estimated at $216,140, approximately $243 per square foot. 806 Putnam Blvd Unit 42A is a home located in Delaware County with nearby schools including Nether Providence El School, Strath Haven Middle School, and Strath Haven High School.
Ownership History
Date
Name
Owned For
Owner Type
Purchase Details
Closed on
Apr 30, 2007
Sold by
Jackson Margaret A and Fawley Robert T
Bought by
Kuhlberg Shelly
Current Estimated Value
Home Financials for this Owner
Home Financials are based on the most recent Mortgage that was taken out on this home.
Original Mortgage
$137,650
Outstanding Balance
$84,002
Interest Rate
6.23%
Mortgage Type
Purchase Money Mortgage
Estimated Equity
$132,138
Purchase Details
Closed on
Dec 15, 2006
Sold by
Fanley Catherine T
Bought by
Jackson Margaret A and Mccutcheon Catherine A
Purchase Details
Closed on
Jul 14, 1998
Sold by
Kershner Jane Walker and Mirarchi Margaret W
Bought by
Fawley Catherine T
Home Financials for this Owner
Home Financials are based on the most recent Mortgage that was taken out on this home.
Original Mortgage
$40,000
Interest Rate
6.98%
Mortgage Type
Purchase Money Mortgage
Create a Home Valuation Report for This Property
The Home Valuation Report is an in-depth analysis detailing your home's value as well as a comparison with similar homes in the area
Home Values in the Area
Average Home Value in this Area
Purchase History
| Date | Buyer | Sale Price | Title Company |
|---|---|---|---|
| Kuhlberg Shelly | $145,000 | None Available | |
| Jackson Margaret A | -- | None Available | |
| Fawley Catherine T | $57,500 | -- |
Source: Public Records
Mortgage History
| Date | Status | Borrower | Loan Amount |
|---|---|---|---|
| Open | Kuhlberg Shelly | $137,650 | |
| Previous Owner | Fawley Catherine T | $40,000 |
Source: Public Records
Tax History Compared to Growth
Tax History
| Year | Tax Paid | Tax Assessment Tax Assessment Total Assessment is a certain percentage of the fair market value that is determined by local assessors to be the total taxable value of land and additions on the property. | Land | Improvement |
|---|---|---|---|---|
| 2025 | $3,598 | $100,930 | $24,000 | $76,930 |
| 2024 | $3,598 | $100,930 | $24,000 | $76,930 |
| 2023 | $3,457 | $100,930 | $24,000 | $76,930 |
| 2022 | $3,384 | $100,930 | $24,000 | $76,930 |
| 2021 | $5,498 | $100,930 | $24,000 | $76,930 |
| 2020 | $3,354 | $57,880 | $21,340 | $36,540 |
| 2019 | $3,262 | $57,880 | $21,340 | $36,540 |
| 2018 | $3,198 | $57,880 | $0 | $0 |
| 2017 | $3,110 | $57,880 | $0 | $0 |
| 2016 | $318 | $57,880 | $0 | $0 |
| 2015 | $318 | $57,880 | $0 | $0 |
| 2014 | $318 | $57,880 | $0 | $0 |
Source: Public Records
Map
Nearby Homes
- 760B Putnam Blvd Unit 31B
- 820B Putnam Blvd Unit 49B
- 844A Putnam Blvd Unit 61A
- 856A Putnam Blvd Unit 67A
- 703 Dover Ct
- 907 Putnam Blvd Unit 106
- 726 W Brookhaven Rd
- 338 Saybrook Ln
- 338A Saybrook Ln
- 787 Pennsylvania Ave
- 987 Putnam Blvd
- 714 Columbus Ct
- 368B Saybrook Ln
- 1000 Putnam Blvd Unit 205
- 619 W Brookhaven Rd
- 433 Saybrook Ln Unit 176
- 308 Hastings Ave Unit 125
- 222 Hillsboro Mills Ln Unit 48
- 210 Cooper Dr
- 157 Meadowbrook Ln
- 806 Putnam Blvd Unit 42B
- 804A Putnam Blvd Unit 41A
- 808B Putnam Blvd Unit 808B Putnam Blvd
- 808 Putnam Blvd Unit 43B
- 808 Putnam Blvd Unit 43A
- 808 Putnam Blvd
- 808B Putnam Blvd
- 804 Putnam Blvd Unit 804A
- 804 Putnam Blvd
- 802B Putnam Blvd Unit 40B
- 810 Putnam Blvd Unit 44A
- 810 Putnam Blvd
- 802 Putnam Blvd Unit 40A
- 802 Putnam Blvd Unit 40B
- 802 Putnam Blvd
- 772 Putnam Blvd Unit 37B
- 772 Putnam Blvd Unit 37A
- 772A Putnam Blvd Unit 37A
- 770 Putnam Blvd Unit 36B
- 770 Putnam Blvd Unit 36A