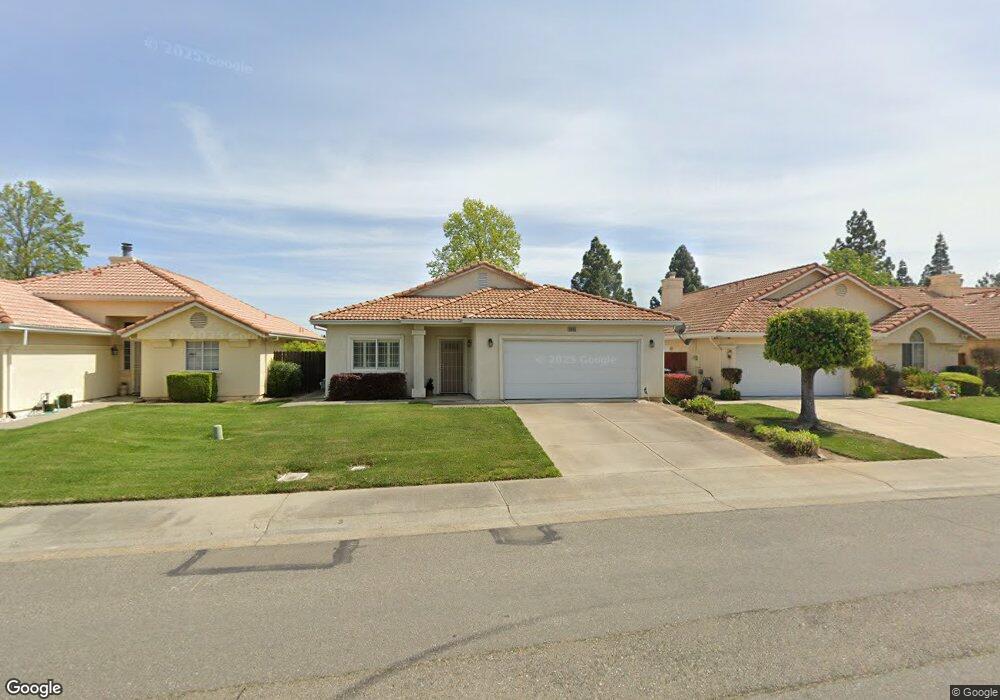
8065 Arroyo Vista Dr Unit 1 Sacramento, CA 95823
North Laguna NeighborhoodEstimated Value: $353,000 - $447,687
2
Beds
2
Baths
1,603
Sq Ft
$264/Sq Ft
Est. Value
About This Home
This home is located at 8065 Arroyo Vista Dr Unit 1, Sacramento, CA 95823 and is currently estimated at $422,922, approximately $263 per square foot. 8065 Arroyo Vista Dr Unit 1 is a home located in Sacramento County with nearby schools including Herman Leimbach Elementary School, Samuel Jackman Middle School, and Valley High School.
Ownership History
Date
Name
Owned For
Owner Type
Purchase Details
Closed on
Nov 29, 2005
Sold by
Newman M Jeanne
Bought by
Newman M Jeanne and The M Jeanne Newman Family Tru
Current Estimated Value
Purchase Details
Closed on
Jun 25, 2003
Sold by
White Russell and Mcmanus White Annita
Bought by
Newman M Jeanne
Home Financials for this Owner
Home Financials are based on the most recent Mortgage that was taken out on this home.
Original Mortgage
$107,500
Outstanding Balance
$45,172
Interest Rate
5.22%
Mortgage Type
Purchase Money Mortgage
Estimated Equity
$377,750
Purchase Details
Closed on
Apr 9, 2002
Sold by
Guaranty Bank
Bought by
White Russell and Mcmanus White Annita
Home Financials for this Owner
Home Financials are based on the most recent Mortgage that was taken out on this home.
Original Mortgage
$138,900
Interest Rate
6.87%
Create a Home Valuation Report for This Property
The Home Valuation Report is an in-depth analysis detailing your home's value as well as a comparison with similar homes in the area
Home Values in the Area
Average Home Value in this Area
Purchase History
| Date | Buyer | Sale Price | Title Company |
|---|---|---|---|
| Newman M Jeanne | -- | -- | |
| Newman M Jeanne | $207,500 | Alliance Title Company | |
| White Russell | $231,500 | Fidelity Title |
Source: Public Records
Mortgage History
| Date | Status | Borrower | Loan Amount |
|---|---|---|---|
| Open | Newman M Jeanne | $107,500 | |
| Previous Owner | White Russell | $138,900 |
Source: Public Records
Tax History Compared to Growth
Tax History
| Year | Tax Paid | Tax Assessment Tax Assessment Total Assessment is a certain percentage of the fair market value that is determined by local assessors to be the total taxable value of land and additions on the property. | Land | Improvement |
|---|---|---|---|---|
| 2025 | $3,418 | $294,998 | $56,858 | $238,140 |
| 2024 | $3,418 | $289,215 | $55,744 | $233,471 |
| 2023 | $3,325 | $283,545 | $54,651 | $228,894 |
| 2022 | $3,282 | $277,986 | $53,580 | $224,406 |
| 2021 | $3,236 | $272,536 | $52,530 | $220,006 |
| 2020 | $3,188 | $269,743 | $51,992 | $217,751 |
| 2019 | $3,131 | $264,455 | $50,973 | $213,482 |
| 2018 | $3,047 | $259,271 | $49,974 | $209,297 |
| 2017 | $2,793 | $235,512 | $45,395 | $190,117 |
| 2016 | $2,563 | $218,068 | $42,033 | $176,035 |
| 2015 | $2,341 | $198,244 | $38,212 | $160,032 |
| 2014 | $2,238 | $187,023 | $36,049 | $150,974 |
Source: Public Records
Map
Nearby Homes
- 8045 Arroyo Vista Dr
- 0 Rangeview Ln
- 8095 E Stockton Blvd
- 8115 Gandy Dancer Way
- 7901 Stevenson Ave
- 7711 Lenhart Rd
- 8016 Stevenson Ave
- 57 Kennelford Cir
- 6439 Valley hi Dr
- 4.13 ACR Lenhart Rd
- 8210 Gandy Dancer Way
- 7952 Grandstaff Dr
- 8077 Goran Ct
- 7948 Grandstaff Dr
- 7422 Sun Point Ln
- 8216 Center Pkwy
- 8186 Gustine Way
- 8220 Center Pkwy Unit 38
- 8228 Center Pkwy Unit 46
- 6028 Hollyhurst Way
- 8069 Arroyo Vista Dr
- 8061 Arroyo Vista Dr
- 8073 Arroyo Vista Dr
- 8057 Arroyo Vista Dr
- 8077 Arroyo Vista Dr
- 8066 Arroyo Vista Dr
- 8053 Arroyo Vista Dr
- 8070 Arroyo Vista Dr
- 8078 Arroyo Vista Dr
- 8081 Arroyo Vista Dr
- 8049 Arroyo Vista Dr
- 8050 Arroyo Vista Dr
- 10 Sausalito Ct
- 8082 Arroyo Vista Dr
- 8085 Arroyo Vista Dr
- 21 Aruba Cir
- 16 Sausalito Ct
- 23 Sausalito Ct
- 8088 Arroyo Vista Dr
- 31 Aruba Cir