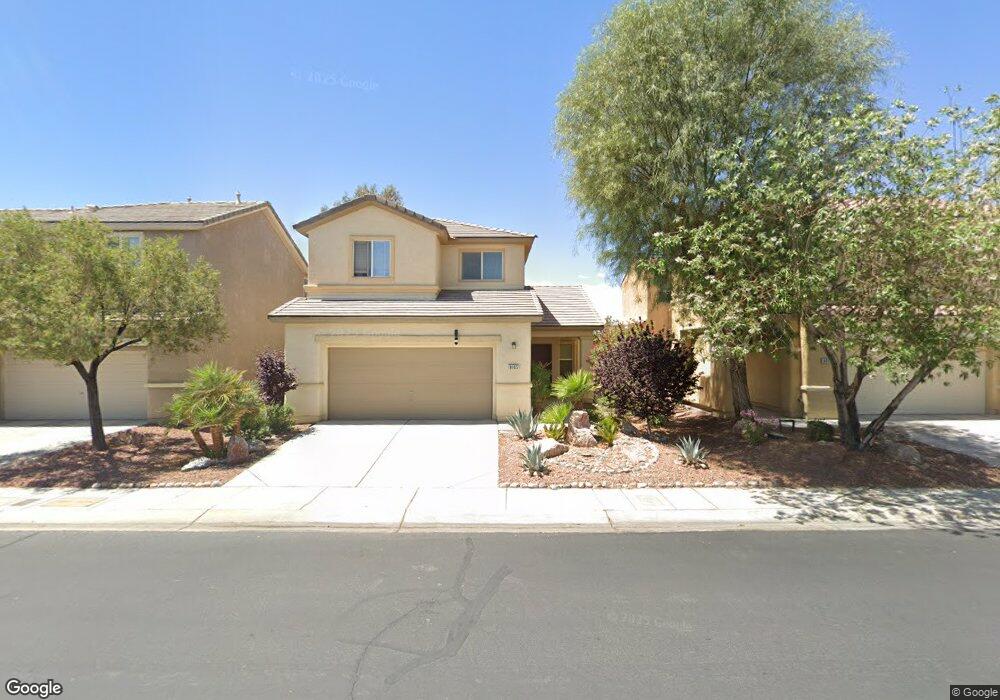
8065 Celina Hills St Las Vegas, NV 89131
Tule Springs NeighborhoodEstimated Value: $412,239 - $427,000
3
Beds
3
Baths
1,669
Sq Ft
$253/Sq Ft
Est. Value
About This Home
This home is located at 8065 Celina Hills St, Las Vegas, NV 89131 and is currently estimated at $422,310, approximately $253 per square foot. 8065 Celina Hills St is a home located in Clark County with nearby schools including Thomas O'Roarke Elementary School, Ralph Cadwallader Middle School, and Arbor View High School.
Ownership History
Date
Name
Owned For
Owner Type
Purchase Details
Closed on
Jun 6, 2025
Sold by
Lee Young S and Jin Jenny Xianghua
Bought by
Lee Young Sang and Jin Jenny Xianghua
Current Estimated Value
Purchase Details
Closed on
Apr 2, 2015
Sold by
Lee Yuling S
Bought by
Lee Yoling S and Jin Xiang Hua
Purchase Details
Closed on
May 26, 2010
Sold by
On Sam
Bought by
Lee Young
Purchase Details
Closed on
Mar 30, 2005
Sold by
On Mylien
Bought by
On Sam
Home Financials for this Owner
Home Financials are based on the most recent Mortgage that was taken out on this home.
Original Mortgage
$248,000
Interest Rate
5.5%
Mortgage Type
New Conventional
Purchase Details
Closed on
Mar 29, 2005
Sold by
Pn Ii Inc
Bought by
On Sam
Home Financials for this Owner
Home Financials are based on the most recent Mortgage that was taken out on this home.
Original Mortgage
$248,000
Interest Rate
5.5%
Mortgage Type
New Conventional
Create a Home Valuation Report for This Property
The Home Valuation Report is an in-depth analysis detailing your home's value as well as a comparison with similar homes in the area
Home Values in the Area
Average Home Value in this Area
Purchase History
| Date | Buyer | Sale Price | Title Company |
|---|---|---|---|
| Lee Young Sang | -- | None Listed On Document | |
| Lee Yoling S | $230,000 | None Available | |
| Lee Young | $130,000 | Titleone Henderson | |
| On Sam | -- | Lawyers Title Of Nevada | |
| On Sam | $310,000 | Lawyers Title Of Nevada |
Source: Public Records
Mortgage History
| Date | Status | Borrower | Loan Amount |
|---|---|---|---|
| Previous Owner | On Sam | $248,000 |
Source: Public Records
Tax History Compared to Growth
Tax History
| Year | Tax Paid | Tax Assessment Tax Assessment Total Assessment is a certain percentage of the fair market value that is determined by local assessors to be the total taxable value of land and additions on the property. | Land | Improvement |
|---|---|---|---|---|
| 2025 | $1,967 | $108,662 | $30,450 | $78,212 |
| 2024 | $1,910 | $108,662 | $30,450 | $78,212 |
| 2023 | $1,910 | $105,491 | $31,850 | $73,641 |
| 2022 | $1,855 | $95,671 | $28,350 | $67,321 |
| 2021 | $1,801 | $87,149 | $23,100 | $64,049 |
| 2020 | $1,745 | $87,474 | $24,255 | $63,219 |
| 2019 | $1,695 | $83,077 | $21,000 | $62,077 |
| 2018 | $1,645 | $78,428 | $18,865 | $59,563 |
| 2017 | $2,186 | $66,674 | $15,400 | $51,274 |
| 2016 | $1,557 | $61,359 | $13,685 | $47,674 |
| 2015 | $1,553 | $54,510 | $10,063 | $44,447 |
| 2014 | $1,508 | $44,622 | $10,063 | $34,559 |
Source: Public Records
Map
Nearby Homes
- 8084 Celina Hills St
- 8205 Celina Hills St
- 8241 Celina Hills St
- 8039 Leather Harness St
- 8078 Leather Harness St
- 8236 Imperial Lakes St
- 8129 Bay Colony St
- 6617 Golden Bit Ave
- 8316 Imperial Lakes St
- 7105 Mercurio Ave
- 6695 Running Colors Ave
- 8113 Loma Del Ray St
- 8505 Mayport Dr
- 8560 Grand Palms Cir
- 7250 Orchard Harvest Ave
- 7245 Golden Rock Ct
- 7265 Golden Rock Ct
- 7275 Golden Rock Ct
- 7250 Golden Rock Ct
- 7255 Golden Rock Ct
- 8069 Celina Hills St
- 8061 Celina Hills St
- 8057 Celina Hills St
- 8073 Celina Hills St
- 8073 Celina Hills St
- 8077 Celina Hills St
- 8077 Celina Hills St
- 8053 Celina Hills St
- 8068 Celina Hills St
- 8064 Celina Hills St
- 8072 Celina Hills St
- 8060 Celina Hills St
- 8081 Celina Hills St
- 8076 Celina Hills St
- 8085 Celina Hills St
- 8080 Celina Hills St
- 8105 Celina Hills St
- 8088 Celina Hills St
- 8109 Celina Hills St
- 8108 Celina Hills St