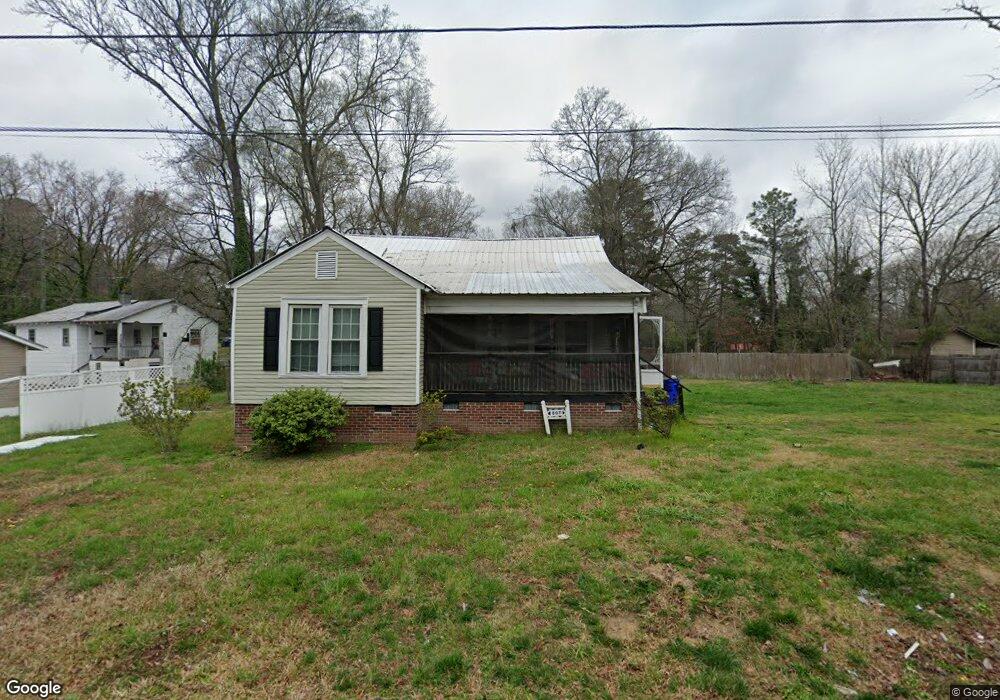
807 13th St Siler City, NC 27344
Estimated Value: $139,629 - $192,000
3
Beds
1
Bath
1,320
Sq Ft
$130/Sq Ft
Est. Value
About This Home
This home is located at 807 13th St, Siler City, NC 27344 and is currently estimated at $172,157, approximately $130 per square foot. 807 13th St is a home located in Chatham County with nearby schools including Virginia Cross Elementary School, Chatham Middle, and Jordan Matthews High.
Ownership History
Date
Name
Owned For
Owner Type
Purchase Details
Closed on
Mar 4, 2024
Sold by
Sutton Rosa M
Bought by
Tenant Louise and Sutton Charlie
Current Estimated Value
Home Financials for this Owner
Home Financials are based on the most recent Mortgage that was taken out on this home.
Original Mortgage
$83,460
Outstanding Balance
$82,007
Interest Rate
6.69%
Mortgage Type
FHA
Estimated Equity
$90,150
Purchase Details
Closed on
Mar 28, 2018
Sold by
Sutton Rosa M
Bought by
Sutton Rosa Mae
Purchase Details
Closed on
Feb 19, 2014
Sold by
Headen Demetrius Elliotte
Bought by
Sutton Rosa M
Purchase Details
Closed on
Aug 19, 2011
Sold by
Sutton Rosa M
Bought by
Headen Demetrius
Create a Home Valuation Report for This Property
The Home Valuation Report is an in-depth analysis detailing your home's value as well as a comparison with similar homes in the area
Home Values in the Area
Average Home Value in this Area
Purchase History
| Date | Buyer | Sale Price | Title Company |
|---|---|---|---|
| Tenant Louise | $85,000 | None Listed On Document | |
| Tenant Louise | $85,000 | None Listed On Document | |
| Sutton Rosa Mae | -- | None Available | |
| Sutton Rosa M | -- | Attorney | |
| Headen Demetrius | -- | None Available |
Source: Public Records
Mortgage History
| Date | Status | Borrower | Loan Amount |
|---|---|---|---|
| Open | Tenant Louise | $83,460 | |
| Closed | Tenant Louise | $83,460 |
Source: Public Records
Tax History Compared to Growth
Tax History
| Year | Tax Paid | Tax Assessment Tax Assessment Total Assessment is a certain percentage of the fair market value that is determined by local assessors to be the total taxable value of land and additions on the property. | Land | Improvement |
|---|---|---|---|---|
| 2025 | $1,239 | $86,248 | $13,440 | $72,808 |
| 2024 | $1,239 | $55,678 | $9,800 | $45,878 |
| 2023 | $704 | $55,678 | $9,800 | $45,878 |
| 2022 | $671 | $55,678 | $9,800 | $45,878 |
| 2021 | $671 | $55,678 | $9,800 | $45,878 |
| 2020 | $672 | $55,497 | $10,000 | $45,497 |
| 2019 | $672 | $55,497 | $10,000 | $45,497 |
| 2018 | $632 | $55,497 | $10,000 | $45,497 |
| 2017 | $632 | $55,497 | $10,000 | $45,497 |
| 2016 | $653 | $58,660 | $10,000 | $48,660 |
| 2015 | $646 | $58,660 | $10,000 | $48,660 |
| 2014 | $650 | $58,996 | $10,000 | $48,996 |
| 2013 | -- | $58,996 | $10,000 | $48,996 |
Source: Public Records
Map
Nearby Homes
- 409 E 10th St
- 00 U S Highway 64
- 17880 U S Highway 64
- TBD E 3rd St
- 1707 N Chatham Ave
- 139 Pondarosa Rd
- 201 Pondarosa Rd
- TBD Siler City Snow Camp Rd
- 909 Harold Andrews Rd
- 1201 Red Sunset Place
- 803 Woodland Dr
- 806 Cliftwood Dr
- 519 W Raleigh St
- 303 W Dolphin St
- 726 S 2nd Ave
- 1004 Candlewood Cir
- 1501 Duet Dr
- 0 Loves Creek Church Rd Unit 2396020
- 701 S Chatham Ave
- Tbd W 3rd St
- 1302 Martin Luther King Junior Blvd
- 810 13th St
- 1302 M l King jr Blvd
- 0 13th St
- 1215 N 6th Ave
- 1302 Martin Luther King jr Blvd
- 811 13th St
- 1308 M l King jr Blvd
- 1218 M l King jr Blvd
- 1218 Martin Luther King Junior Blvd
- 1211 N 6th Ave
- 0 Martin Luther King Junior Blvd
- 1218 M l King jr Blvd
- 1213 N 6th Ave
- 904 14th St
- 0 Street Unit 2337245
- 1307 M l King jr Blvd
- 1212 N 6th Ave
- 1215 M l King jr Blvd
- 1311 M l King jr Blvd