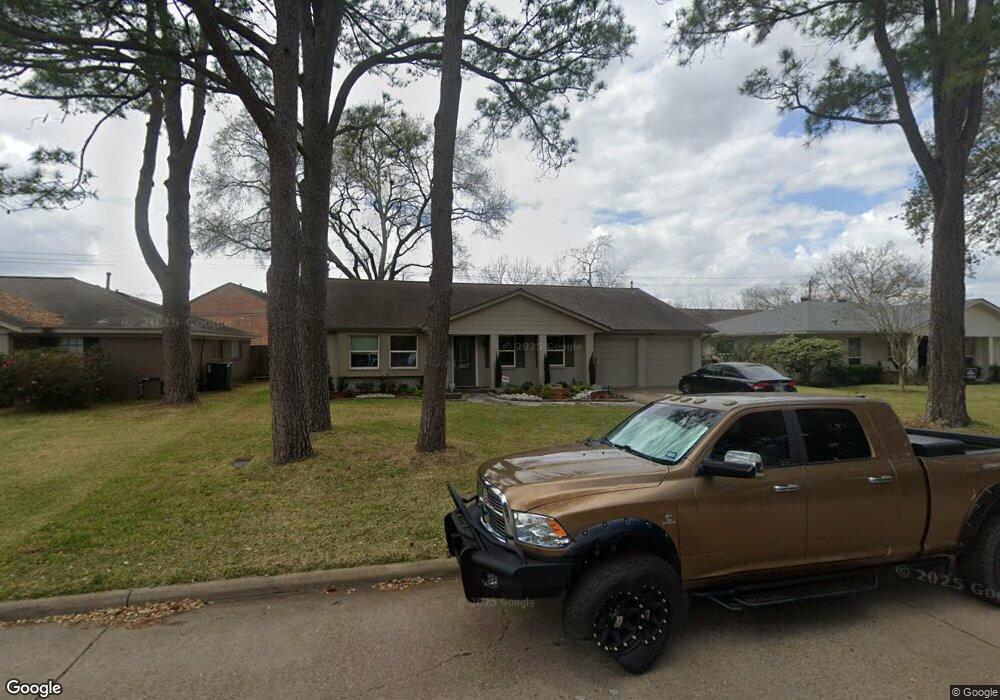
807 Carlingford Ln Houston, TX 77079
Energy Corridor NeighborhoodEstimated Value: $581,776 - $601,000
3
Beds
2
Baths
1,850
Sq Ft
$320/Sq Ft
Est. Value
About This Home
This home is located at 807 Carlingford Ln, Houston, TX 77079 and is currently estimated at $591,944, approximately $319 per square foot. 807 Carlingford Ln is a home located in Harris County with nearby schools including Wilchester Elementary School, Spring Forest Middle School, and Stratford High School.
Ownership History
Date
Name
Owned For
Owner Type
Purchase Details
Closed on
May 4, 2012
Sold by
Park Jong Jin and Park Hwa Ja
Bought by
Denman Christopher
Current Estimated Value
Home Financials for this Owner
Home Financials are based on the most recent Mortgage that was taken out on this home.
Original Mortgage
$207,000
Outstanding Balance
$144,824
Interest Rate
4.11%
Mortgage Type
New Conventional
Estimated Equity
$447,120
Purchase Details
Closed on
Jul 10, 2008
Sold by
Chu Eun Rae and Chu Pui Lam
Bought by
Park Jong Jin and Park Hwa Ja
Purchase Details
Closed on
Feb 14, 1994
Sold by
Goldhawk Reginald H and Goldhawk Elizabeth L
Bought by
Yoon Eun Rae and Park Jong Jin
Home Financials for this Owner
Home Financials are based on the most recent Mortgage that was taken out on this home.
Original Mortgage
$55,000
Interest Rate
7.25%
Create a Home Valuation Report for This Property
The Home Valuation Report is an in-depth analysis detailing your home's value as well as a comparison with similar homes in the area
Home Values in the Area
Average Home Value in this Area
Purchase History
| Date | Buyer | Sale Price | Title Company |
|---|---|---|---|
| Denman Christopher | -- | None Available | |
| Park Jong Jin | -- | None Available | |
| Yoon Eun Rae | -- | Stewart Title Houston Divisi |
Source: Public Records
Mortgage History
| Date | Status | Borrower | Loan Amount |
|---|---|---|---|
| Open | Denman Christopher | $207,000 | |
| Previous Owner | Yoon Eun Rae | $55,000 |
Source: Public Records
Tax History Compared to Growth
Tax History
| Year | Tax Paid | Tax Assessment Tax Assessment Total Assessment is a certain percentage of the fair market value that is determined by local assessors to be the total taxable value of land and additions on the property. | Land | Improvement |
|---|---|---|---|---|
| 2025 | $8,115 | $521,229 | $397,000 | $124,229 |
| 2024 | $8,115 | $521,229 | $397,000 | $124,229 |
| 2023 | $8,115 | $509,675 | $397,000 | $112,675 |
| 2022 | $10,431 | $446,181 | $357,300 | $88,881 |
| 2021 | $10,053 | $411,755 | $333,480 | $78,275 |
| 2020 | $10,229 | $408,260 | $333,480 | $74,780 |
| 2019 | $10,688 | $408,260 | $333,480 | $74,780 |
| 2018 | $3,931 | $414,711 | $333,480 | $81,231 |
| 2017 | $9,551 | $414,711 | $333,480 | $81,231 |
| 2016 | $8,683 | $422,512 | $333,480 | $89,032 |
| 2015 | $5,631 | $422,512 | $333,480 | $89,032 |
| 2014 | $5,631 | $0 | $0 | $0 |
Source: Public Records
Map
Nearby Homes
- 14102 Pinerock Ln
- 14123 Misty Meadow Ln
- 14171 Misty Meadow Ln
- 14311 Misty Meadow Ln
- 14387 Misty Meadow Ln
- 14226 Misty Meadow Ln
- 14228 Misty Meadow Ln
- 14143 Lost Meadow Ln
- 800 Country Place Dr Unit 506
- 800 Country Place Dr Unit 1305
- 800 Country Place Dr Unit 909
- 14322 Misty Meadow Ln
- 1071 Country Place Dr Unit 1071
- 13931 Kingsride Ln
- 14325 Lost Meadow Ln
- 14213 Lost Meadow Ln
- 1334 Country Place Dr
- 1310 Country Place Dr
- 880 Tully Rd Unit 29
- 880 Tully Rd Unit 40
- 803 Carlingford Ln
- 811 Carlingford Ln
- 14135 Pinerock Ln
- 14134 Kimberley Ln
- 767 Carlingford Ln
- 14131 Pinerock Ln
- 14130 Kimberley Ln
- 819 Carlingford Ln
- 14134 Pinerock Ln
- 14135 Kimberley Ln
- 14126 Kimberley Ln
- 14127 Pinerock Ln
- 14130 Pinerock Ln
- 14131 Kimberley Ln
- 759 Carlingford Ln
- 14122 Kimberley Ln
- 14123 Pinerock Ln
- 14126 Pinerock Ln
- 14127 Kimberley Ln
- 14135 Queensbury Ln