
Seller's Agent in 2024
Paul Wyman
The Wyman Group
(765) 419-1021
1 in this area
515 Total Sales

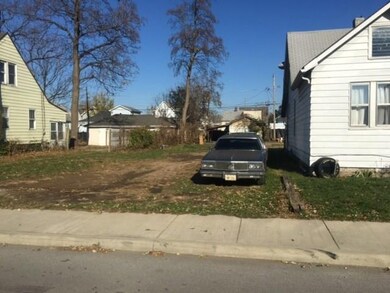
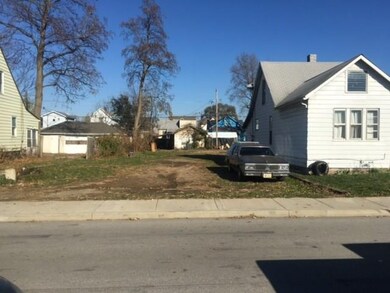


Golden opportunity to build a new home right in the heart of all the redevelopment!
Last Agent to Sell the Property
No Limit Real Estate, LLC License #RB14033327 Listed on: 12/02/2016
Property Type
Est. Annual Taxes
Lot Details
Community Details
Listing and Financial Details
| Date | Type | Sale Price | Title Company |
|---|---|---|---|
| Quit Claim Deed | -- | Investors Title | |
| Deed | $50,000 | -- | |
| Warranty Deed | $50,000 | Best Title Services | |
| Deed | $38,500 | -- | |
| Deed | $38,500 | Best Title Services | |
| Deed | $27,500 | -- | |
| Deed | $27,500 | Best Title Svcs | |
| Legal Action Court Order | $750 | -- | |
| Quit Claim Deed | $750 | None Available | |
| Public Action Common In Florida Clerks Tax Deed Or Tax Deeds Or Property Sold For Taxes | $11,380 | None Available |
| Date | Status | Loan Amount | Loan Type |
|---|---|---|---|
| Previous Owner | $285,000 | New Conventional | |
| Previous Owner | $58,500 | Credit Line Revolving |
| Date | Event | Price | Change | Sq Ft Price |
|---|---|---|---|---|
| 03/14/2025 03/14/25 | Price Changed | $479,900 | 0.0% | $143 / Sq Ft |
| 03/14/2025 03/14/25 | Price Changed | $479,900 | -2.0% | $143 / Sq Ft |
| 10/04/2024 10/04/24 | Price Changed | $489,900 | 0.0% | $146 / Sq Ft |
| 10/04/2024 10/04/24 | For Sale | $489,900 | -5.8% | $146 / Sq Ft |
| 10/04/2024 10/04/24 | For Sale | $519,900 | 0.0% | $155 / Sq Ft |
| 09/20/2024 09/20/24 | Off Market | $519,900 | -- | -- |
| 08/28/2023 08/28/23 | Price Changed | $519,900 | -5.5% | $155 / Sq Ft |
| 07/25/2023 07/25/23 | For Sale | $549,900 | +44.7% | $164 / Sq Ft |
| 10/25/2019 10/25/19 | Sold | $380,000 | -5.0% | $113 / Sq Ft |
| 09/26/2019 09/26/19 | Pending | -- | -- | -- |
| 08/23/2019 08/23/19 | Price Changed | $399,900 | -2.4% | $119 / Sq Ft |
| 08/19/2019 08/19/19 | Price Changed | $409,900 | -1.2% | $122 / Sq Ft |
| 07/26/2019 07/26/19 | Price Changed | $415,000 | -2.4% | $124 / Sq Ft |
| 07/11/2019 07/11/19 | Price Changed | $425,000 | -4.5% | $127 / Sq Ft |
| 07/02/2019 07/02/19 | For Sale | $445,000 | +790.0% | $133 / Sq Ft |
| 04/30/2018 04/30/18 | Sold | $50,000 | 0.0% | $25 / Sq Ft |
| 04/19/2018 04/19/18 | Off Market | $50,000 | -- | -- |
| 04/05/2018 04/05/18 | Pending | -- | -- | -- |
| 04/03/2018 04/03/18 | Price Changed | $54,900 | -8.3% | $27 / Sq Ft |
| 03/21/2018 03/21/18 | Price Changed | $59,900 | -7.7% | $30 / Sq Ft |
| 03/10/2018 03/10/18 | For Sale | $64,900 | +136.0% | $32 / Sq Ft |
| 04/24/2017 04/24/17 | Sold | $27,500 | -25.7% | $14 / Sq Ft |
| 04/10/2017 04/10/17 | For Sale | $37,000 | +34.5% | $18 / Sq Ft |
| 01/27/2017 01/27/17 | Off Market | $27,500 | -- | -- |
| 12/27/2016 12/27/16 | Price Changed | $37,000 | -7.5% | $18 / Sq Ft |
| 12/02/2016 12/02/16 | For Sale | $40,000 | -- | $20 / Sq Ft |
| Year | Tax Paid | Tax Assessment Tax Assessment Total Assessment is a certain percentage of the fair market value that is determined by local assessors to be the total taxable value of land and additions on the property. | Land | Improvement |
|---|---|---|---|---|
| 2024 | $14,467 | $606,600 | $32,300 | $574,300 |
| 2023 | $14,467 | $606,200 | $32,300 | $573,900 |
| 2022 | $13,877 | $583,900 | $32,300 | $551,600 |
| 2021 | $11,700 | $504,900 | $32,300 | $472,600 |
| 2020 | $10,862 | $466,900 | $32,300 | $434,600 |
| 2019 | $6,557 | $275,700 | $3,600 | $272,100 |
| 2018 | $112 | $3,600 | $3,600 | $0 |
| 2017 | $99 | $3,600 | $3,600 | $0 |
| 2016 | $840 | $3,600 | $3,600 | $0 |
| 2014 | $105 | $3,600 | $3,600 | $0 |
| 2013 | $100 | $3,600 | $3,600 | $0 |
Seller's Agent in 2024
Paul Wyman
The Wyman Group
(765) 419-1021
1 in this area
515 Total Sales
Seller's Agent in 2019
Jeremy Sandlin
F.C. Tucker Company
(317) 441-4675
11 in this area
407 Total Sales
R
Buyer's Agent in 2019
Robert Antoine
The Wyman Group
A
Seller's Agent in 2018
Allen Phelps
Durham Realty, LLC
(317) 657-4497
12 Total Sales
Seller's Agent in 2017
Charlene Gaard
No Limit Real Estate, LLC
(317) 440-2149
1 in this area
289 Total Sales
Buyer's Agent in 2017
Angela Tripp
BluPrint Real Estate Group
(317) 490-9261
102 Total Sales
Source: MIBOR Broker Listing Cooperative®
MLS Number: MBR21455163
APN: 49-11-13-132-002.000-101
Disclaimer: Certain information contained herein is derived from information provided by parties other than Homes.com. All information provided is deemed reliable, but is not guaranteed to be accurate and should be independently verified.
![]() Based on information submitted to the MLS GRID. All data is obtained from various sources and may not have been verified by broker or MLS GRID. Supplied Open House Information is subject to change without notice. All information should be independently reviewed and verified for accuracy. Properties may or may not be listed by the office/agent presenting the information. Some IDX listings have been excluded from this website.
Based on information submitted to the MLS GRID. All data is obtained from various sources and may not have been verified by broker or MLS GRID. Supplied Open House Information is subject to change without notice. All information should be independently reviewed and verified for accuracy. Properties may or may not be listed by the office/agent presenting the information. Some IDX listings have been excluded from this website.