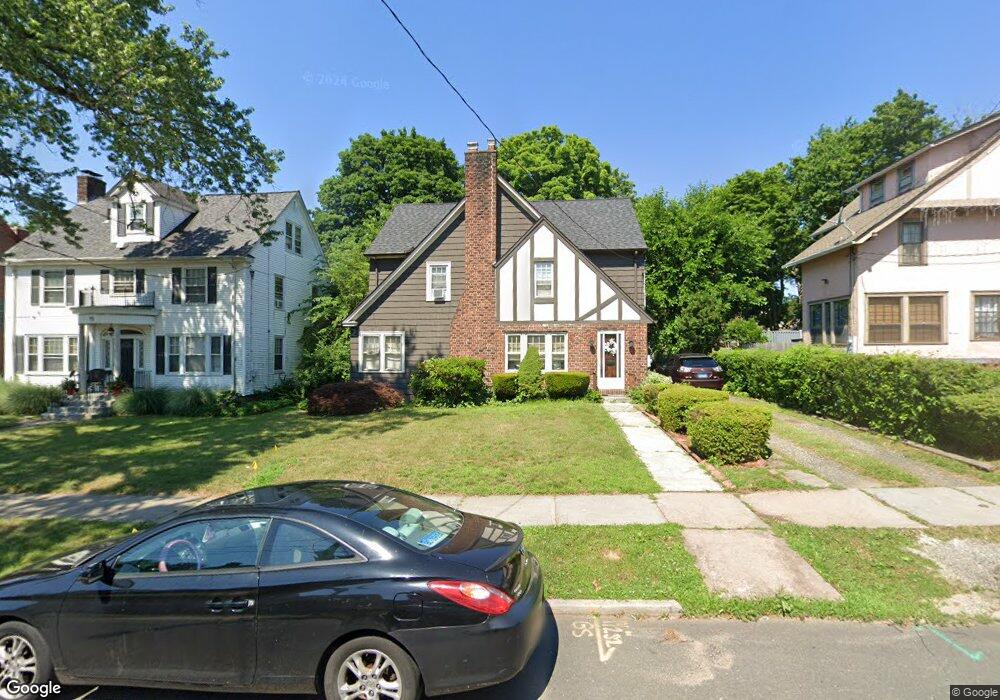
81 Canterbury St Hartford, CT 06112
Blue Hills NeighborhoodEstimated Value: $256,000 - $343,000
4
Beds
2
Baths
2,193
Sq Ft
$136/Sq Ft
Est. Value
About This Home
This home is located at 81 Canterbury St, Hartford, CT 06112 and is currently estimated at $299,078, approximately $136 per square foot. 81 Canterbury St is a home located in Hartford County with nearby schools including Rawson School, Noah Webster Micro Society School, and McKinley School.
Ownership History
Date
Name
Owned For
Owner Type
Purchase Details
Closed on
May 18, 2022
Sold by
Ross Kerry
Bought by
Moore Yvette L
Current Estimated Value
Purchase Details
Closed on
May 11, 2021
Sold by
Daniels Yvonne L
Bought by
Ross Kerry
Create a Home Valuation Report for This Property
The Home Valuation Report is an in-depth analysis detailing your home's value as well as a comparison with similar homes in the area
Home Values in the Area
Average Home Value in this Area
Purchase History
| Date | Buyer | Sale Price | Title Company |
|---|---|---|---|
| Moore Yvette L | -- | None Available | |
| Ross Kerry | -- | None Available |
Source: Public Records
Tax History Compared to Growth
Tax History
| Year | Tax Paid | Tax Assessment Tax Assessment Total Assessment is a certain percentage of the fair market value that is determined by local assessors to be the total taxable value of land and additions on the property. | Land | Improvement |
|---|---|---|---|---|
| 2025 | $4,597 | $66,665 | $7,534 | $59,131 |
| 2024 | $4,597 | $66,665 | $7,534 | $59,131 |
| 2023 | $4,597 | $66,665 | $7,534 | $59,131 |
| 2022 | $4,597 | $66,665 | $7,534 | $59,131 |
| 2021 | $3,846 | $51,765 | $8,960 | $42,805 |
| 2020 | $3,846 | $51,765 | $8,960 | $42,805 |
| 2019 | $3,846 | $51,765 | $8,960 | $42,805 |
| 2018 | $3,716 | $50,020 | $8,658 | $41,362 |
| 2016 | $3,872 | $52,116 | $8,246 | $43,870 |
| 2015 | $3,688 | $49,640 | $7,854 | $41,786 |
| 2014 | $3,598 | $48,427 | $7,662 | $40,765 |
Source: Public Records
Map
Nearby Homes
- 109 Blue Hills Ave
- 111 Westbourne Pkwy Unit 113
- 102 Thomaston St Unit 104
- 157 Pembroke St Unit 159
- 83 Colebrook St Unit 85
- 138 Kent St Unit 140
- 25 Cornwall St
- 211 Holcomb St Unit 213
- 103 Baltimore St
- 218 Holcomb St Unit 220
- 131-135,137-145,119- Albany Ave
- 141 Greenfield St
- 181 Westminster St
- 87 Mansfield St Unit 89
- 355 Cornwall St Unit 357
- 4 Deerfield Ave
- 33 E Raymond St Unit 35
- 59 Mansfield St Unit 61
- 275 Westland St
- 90 Manchester St
- 77 Canterbury St
- 85 Canterbury St
- 73 Canterbury St
- 91 Canterbury St
- 67 Canterbury St
- 95 Canterbury St
- 206 Blue Hills Ave Unit 208
- 202 Blue Hills Ave Unit 204
- 84 Canterbury St
- 80 Canterbury St
- 88 Canterbury St
- 200 Blue Hills Ave
- 63 Canterbury St
- 76 Canterbury St
- 214 Blue Hills Ave Unit 216
- 202 Blue Hills Ave
- 202 Blue Hills Ave
- 72 Canterbury St
- 218 Blue Hills Ave Unit 220
- 59 Canterbury St