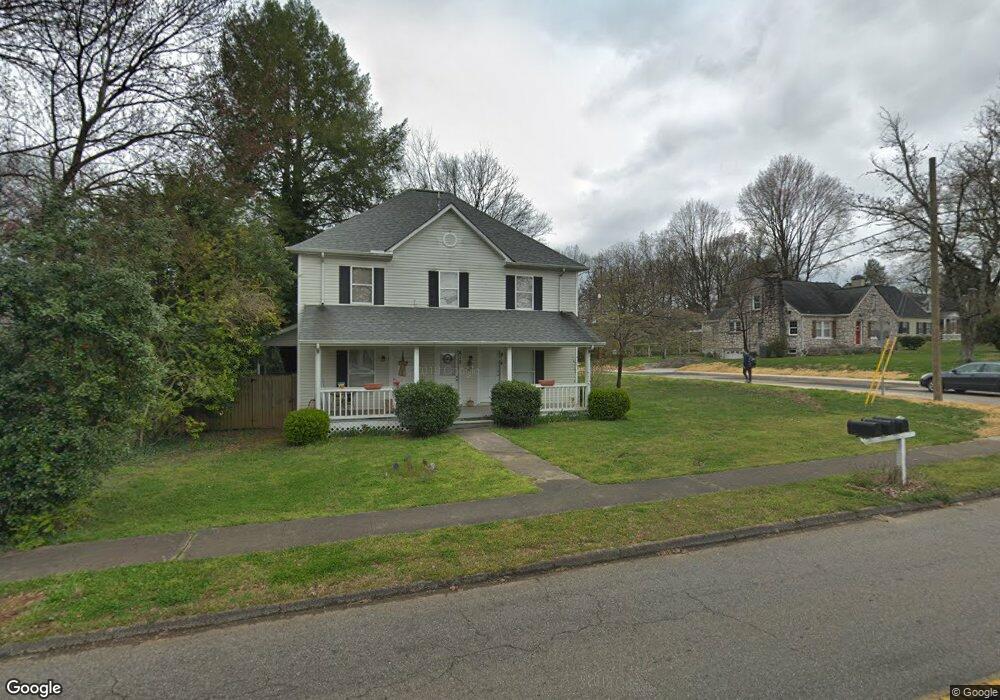
810 Mountain View Ave Unit 814 Maryville, TN 37803
Estimated Value: $324,000 - $421,000
--
Bed
3
Baths
2,478
Sq Ft
$153/Sq Ft
Est. Value
About This Home
This home is located at 810 Mountain View Ave Unit 814, Maryville, TN 37803 and is currently estimated at $378,981, approximately $152 per square foot. 810 Mountain View Ave Unit 814 is a home located in Blount County with nearby schools including Sam Houston Elementary School, Maryville Junior High School, and Montgomery Ridge Intermediate School.
Ownership History
Date
Name
Owned For
Owner Type
Purchase Details
Closed on
May 7, 2024
Sold by
White Karen A
Bought by
White Karen A and Looney Kent K
Current Estimated Value
Purchase Details
Closed on
Jan 31, 2013
Sold by
White Randall and White Karen A
Bought by
White Karen A
Purchase Details
Closed on
May 21, 2009
Sold by
Mitchell Scott Roy
Bought by
White Randall
Purchase Details
Closed on
Sep 29, 2006
Sold by
Nightowl Investments Llc
Bought by
Ritchell Scott Roy
Purchase Details
Closed on
Sep 18, 2003
Bought by
Claiborne Heath
Purchase Details
Closed on
Sep 17, 2003
Bought by
Housing Re-Development Inc
Purchase Details
Closed on
Apr 1, 2003
Sold by
Reed Chris B
Bought by
Amsouth Bank
Purchase Details
Closed on
Nov 26, 1938
Bought by
Sterling Guy C
Create a Home Valuation Report for This Property
The Home Valuation Report is an in-depth analysis detailing your home's value as well as a comparison with similar homes in the area
Home Values in the Area
Average Home Value in this Area
Purchase History
| Date | Buyer | Sale Price | Title Company |
|---|---|---|---|
| White Karen A | -- | None Listed On Document | |
| White Karen A | -- | -- | |
| White Karen | -- | -- | |
| White Randall | -- | -- | |
| Ritchell Scott Roy | $145,000 | -- | |
| Claiborne Heath | $99,000 | -- | |
| Housing Re-Development Inc | $68,900 | -- | |
| Amsouth Bank | -- | -- | |
| Sterling Guy C | -- | -- |
Source: Public Records
Tax History Compared to Growth
Tax History
| Year | Tax Paid | Tax Assessment Tax Assessment Total Assessment is a certain percentage of the fair market value that is determined by local assessors to be the total taxable value of land and additions on the property. | Land | Improvement |
|---|---|---|---|---|
| 2025 | -- | $133,840 | $0 | $0 |
| 2024 | -- | $133,840 | $27,200 | $106,640 |
| 2023 | $2,128 | $133,840 | $27,200 | $106,640 |
| 2022 | $1,837 | $74,360 | $13,600 | $60,760 |
| 2021 | $3,525 | $74,360 | $13,600 | $60,760 |
| 2020 | $3,525 | $74,360 | $13,600 | $60,760 |
| 2019 | $3,525 | $74,360 | $13,600 | $60,760 |
| 2018 | $3,289 | $69,400 | $13,200 | $56,200 |
| 2017 | $3,289 | $69,400 | $13,200 | $56,200 |
| 2016 | $3,220 | $69,400 | $13,200 | $56,200 |
| 2015 | $2,998 | $69,400 | $13,200 | $56,200 |
| 2014 | $2,834 | $69,400 | $13,200 | $56,200 |
| 2013 | $2,834 | $65,600 | $0 | $0 |
Source: Public Records
Map
Nearby Homes
- 239 S Magnolia St
- 409 Melrose St
- 1113 Melvin Ave
- 507 Montvale Rd Unit 511
- 508 S Ruth St
- 418 Highland Ave
- 403 S Maple St
- 108 S Maple St Unit 120
- 411 S Maple St
- 810 S Cedar St
- 298 Gamble Ave
- 1115 Tapoco Ave
- 717 Cates St Unit 725
- 406 Montvale Station Rd
- 402 Montvale Station Rd
- 443 Landau Dr
- 522 N Houston St
- 405 Landau Dr
- 500 Cardinal St
- 425 S Court St Unit 427
- 808 Mountain View Ave
- 904 Mountain View Ave
- 806 Mountain View Ave
- 302 S Cedar St
- 907 Mountain View Ave
- 809 Mountain View Ave Unit 813
- 804 Mountain View Ave
- 910 Mountain View Ave
- 817 Mountain View Ave
- 304 S Cedar St
- 905 Sterling Ave
- 807 Mountain View Ave
- 909 Mountain View Ave
- 802 Mountain View Ave
- 315 Melrose St
- 914 Mountain View Ave
- 805 Mountain View Ave
- 907 Sterling Ave
- 319 Melrose St
- 917 Mountain View Ave