Estimated Value: $815,000 - $888,000
--
Bed
--
Bath
1,880
Sq Ft
$450/Sq Ft
Est. Value
About This Home
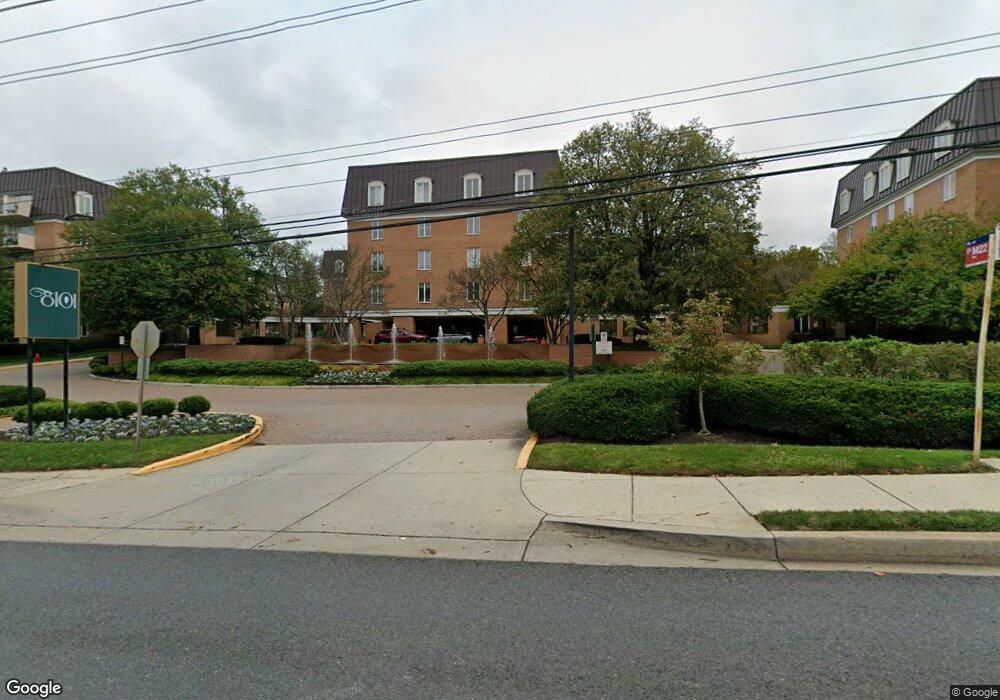
This home is located at 8101 Connecticut Ave Unit N204, Chevy Chase, MD 20815 and is currently estimated at $845,786, approximately $449 per square foot. 8101 Connecticut Ave Unit N204 is a home located in Montgomery County with nearby schools including Hoover School, Rosemary Hills Elementary School, and Riverside Intermediate School.
Ownership History
Date
Name
Owned For
Owner Type
Purchase Details
Closed on
Oct 3, 2018
Sold by
Lichtman Bennett R and Lichtman Alan D
Bought by
Hintersehr Stephen J and Hintersehr Donna M
Current Estimated Value
Purchase Details
Closed on
Dec 29, 2017
Sold by
Lichtman Milton and Lichtman Joan B
Bought by
Lichtman Bennett R and Lichtman Alan D
Purchase Details
Closed on
Aug 31, 2006
Sold by
Baron Julie
Bought by
Lichtman Milton
Purchase Details
Closed on
Jul 31, 2006
Sold by
Baron Julie
Bought by
Lichtman Milton
Purchase Details
Closed on
Nov 2, 2005
Sold by
Berman Harry L Tr
Bought by
Baron Julie
Purchase Details
Closed on
Sep 19, 2005
Sold by
Baron Julie
Bought by
Baron Julie
Purchase Details
Closed on
Sep 7, 2005
Sold by
Berman Harry L Tr
Bought by
Baron Julie
Purchase Details
Closed on
Oct 23, 1998
Sold by
Berman Harry L and Berman E J
Bought by
Harry L Berman Tr
Create a Home Valuation Report for This Property
The Home Valuation Report is an in-depth analysis detailing your home's value as well as a comparison with similar homes in the area
Home Values in the Area
Average Home Value in this Area
Purchase History
| Date | Buyer | Sale Price | Title Company |
|---|---|---|---|
| Hintersehr Stephen J | $615,000 | Quiet Title Llc | |
| Lichtman Bennett R | -- | None Available | |
| Lichtman Milton | $660,000 | -- | |
| Lichtman Milton | $660,000 | -- | |
| Baron Julie | -- | -- | |
| Baron Julie | -- | -- | |
| Baron Julie | -- | -- | |
| Baron Julie | -- | -- | |
| Harry L Berman Tr | -- | -- |
Source: Public Records
Tax History Compared to Growth
Tax History
| Year | Tax Paid | Tax Assessment Tax Assessment Total Assessment is a certain percentage of the fair market value that is determined by local assessors to be the total taxable value of land and additions on the property. | Land | Improvement |
|---|---|---|---|---|
| 2025 | $8,666 | $820,000 | $246,000 | $574,000 |
| 2024 | $8,666 | $747,333 | $0 | $0 |
| 2023 | $6,997 | $674,667 | $0 | $0 |
| 2022 | $6,008 | $602,000 | $180,600 | $421,400 |
| 2021 | $5,676 | $594,667 | $0 | $0 |
| 2020 | $6,531 | $587,333 | $0 | $0 |
| 2019 | $6,446 | $580,000 | $168,000 | $412,000 |
| 2018 | $7,717 | $560,000 | $0 | $0 |
| 2017 | $5,336 | $540,000 | $0 | $0 |
| 2016 | $4,984 | $520,000 | $0 | $0 |
| 2015 | $4,984 | $520,000 | $0 | $0 |
| 2014 | $4,984 | $520,000 | $0 | $0 |
Source: Public Records
About This Building
Map
Nearby Homes
- 8101 Connecticut Ave Unit C708
- 8101 Connecticut Ave Unit S307
- 8101 Connecticut Ave Unit N109
- 3663 Chevy Chase Lake Dr
- 8551 Connecticut Ave Unit 207
- The Park Plan at Ritz-Carlton Residences
- The Chase Plan at Ritz-Carlton Residences
- The Lake Plan at Ritz-Carlton Residences
- 8551 Connecticut Ave Unit 411
- Lion and Crown - Penthouse Plan at Ritz-Carlton Residences
- 8551 Connecticut Ave Unit 412
- 8551 Connecticut Ave Unit 603
- 8551 Connecticut Ave Unit 201
- 8551 Connecticut Ave Unit 206
- 8625 Erdem Place
- 8613 Erdem Place
- 8611 Erdem Place
- 8609 Erdem Place
- 8607 Erdem Place
- 8616 Erdem Place
- 8101 Connecticut Ave Unit N-409
- 8101 Connecticut Ave Unit C-607
- 8101 Connecticut Ave Unit C-405
- 8101 Connecticut Ave Unit S-600
- 8101 Connecticut Ave Unit S-607
- 8101 Connecticut Ave Unit N-608
- 8101 Connecticut Ave Unit C700
- 8101 Connecticut Ave Unit C701
- 8101 Connecticut Ave Unit N-400
- 8101 Connecticut Ave Unit N209
- 8101 Connecticut Ave Unit N405
- 8101 Connecticut Ave Unit S405
- 8101 Connecticut Ave Unit S700
- 8101 Connecticut Ave Unit C306
- 8101 Connecticut Ave Unit N705
- 8101 Connecticut Ave Unit S602
- 8101 Connecticut Ave
- 8101 Connecticut Ave
- 8101 Connecticut Ave
- 8101 Connecticut Ave Unit C305