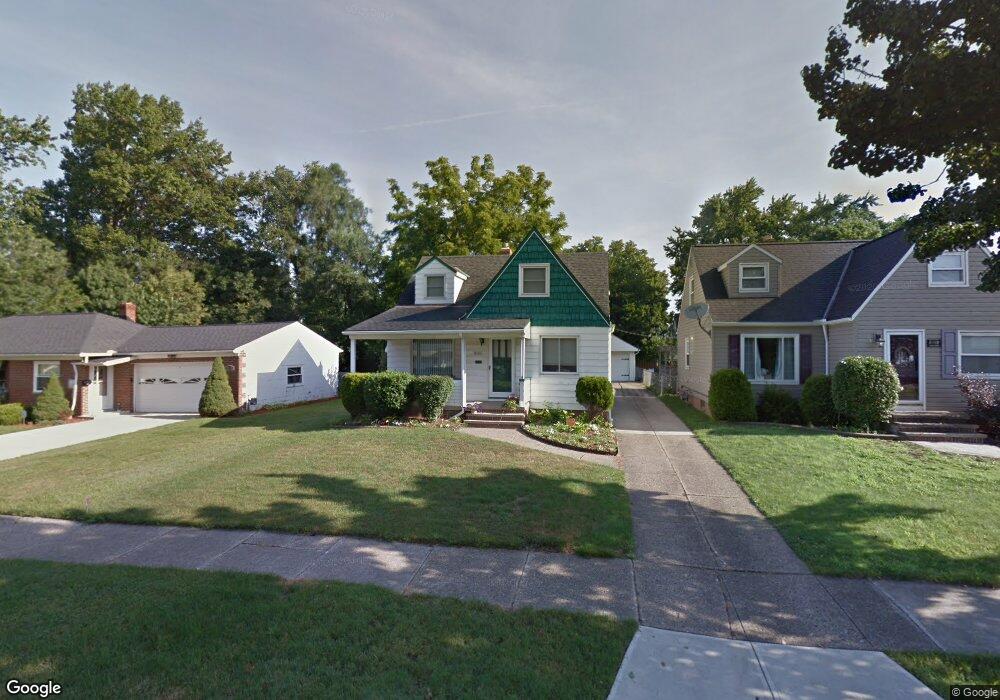
8102 Thornton Dr Cleveland, OH 44129
Estimated Value: $205,852 - $220,000
4
Beds
2
Baths
1,488
Sq Ft
$143/Sq Ft
Est. Value
About This Home
This home is located at 8102 Thornton Dr, Cleveland, OH 44129 and is currently estimated at $212,463, approximately $142 per square foot. 8102 Thornton Dr is a home located in Cuyahoga County with nearby schools including Renwood Elementary School, Thoreau Park Elementary School, and Shiloh Middle School.
Ownership History
Date
Name
Owned For
Owner Type
Purchase Details
Closed on
Apr 23, 2010
Sold by
Lentz James D and Lentz Nora E
Bought by
Milkovich Joseph W
Current Estimated Value
Home Financials for this Owner
Home Financials are based on the most recent Mortgage that was taken out on this home.
Original Mortgage
$76,000
Outstanding Balance
$50,644
Interest Rate
5.01%
Mortgage Type
New Conventional
Estimated Equity
$161,819
Purchase Details
Closed on
Aug 14, 1996
Sold by
Kotesovec Norman J
Bought by
Lentz James D and Lentz Nora E
Purchase Details
Closed on
Jul 31, 1990
Sold by
Dorsey James William
Bought by
Kotesovec Norman J
Purchase Details
Closed on
Aug 14, 1984
Sold by
Dorsey James William
Bought by
Dorsey James William
Purchase Details
Closed on
Dec 30, 1977
Sold by
Campbell Ronald W and Campbell Rosemarie
Bought by
Dorsey James William
Purchase Details
Closed on
Jan 1, 1975
Bought by
Campbell Ronald W and Campbell Rosemarie
Create a Home Valuation Report for This Property
The Home Valuation Report is an in-depth analysis detailing your home's value as well as a comparison with similar homes in the area
Home Values in the Area
Average Home Value in this Area
Purchase History
| Date | Buyer | Sale Price | Title Company |
|---|---|---|---|
| Milkovich Joseph W | $95,000 | City Title Agency | |
| Lentz James D | $93,000 | -- | |
| Kotesovec Norman J | $76,800 | -- | |
| Dorsey James William | -- | -- | |
| Dorsey James William | $43,500 | -- | |
| Campbell Ronald W | -- | -- |
Source: Public Records
Mortgage History
| Date | Status | Borrower | Loan Amount |
|---|---|---|---|
| Open | Milkovich Joseph W | $76,000 |
Source: Public Records
Tax History Compared to Growth
Tax History
| Year | Tax Paid | Tax Assessment Tax Assessment Total Assessment is a certain percentage of the fair market value that is determined by local assessors to be the total taxable value of land and additions on the property. | Land | Improvement |
|---|---|---|---|---|
| 2024 | $3,407 | $55,825 | $11,340 | $44,485 |
| 2023 | $3,033 | $42,630 | $10,010 | $32,620 |
| 2022 | $3,003 | $42,630 | $10,010 | $32,620 |
| 2021 | $3,089 | $42,630 | $10,010 | $32,620 |
| 2020 | $2,706 | $32,800 | $7,700 | $25,100 |
| 2019 | $2,590 | $93,700 | $22,000 | $71,700 |
| 2018 | $2,605 | $32,800 | $7,700 | $25,100 |
| 2017 | $2,424 | $28,360 | $5,990 | $22,370 |
| 2016 | $2,409 | $28,360 | $5,990 | $22,370 |
| 2015 | $2,299 | $28,360 | $5,990 | $22,370 |
| 2014 | $2,299 | $28,950 | $6,090 | $22,860 |
Source: Public Records
Map
Nearby Homes
- 5972 Westminster Dr
- 8514 Deerfield Dr
- 7514 Spring Garden Rd
- 5906 Twin Lakes Dr
- 7503 Whittington Dr
- 7615 Bertha Ave
- 5926 Deering Ave
- 7619 Snow Rd
- 6136 Ridge Rd
- 7115 Hampstead Ave
- 5860 Pearl Rd
- 7014 Thornton Dr
- 6111 Manchester Rd
- 7600 Dresden Ave
- 6096 Wareham Dr
- 6168 Manchester Rd
- 8017 Wainstead Dr
- 7910 Dresden Ave
- 6818 Hampstead Ave
- 6227 Ridge Rd
- 8024 Thornton Dr
- 8116 Thornton Dr
- 8020 Thornton Dr
- 8016 Thornton Dr
- 8107 Dartworth Dr
- 8111 Dartworth Dr
- 8021 Dartworth Dr
- 8012 Thornton Dr
- 8115 Dartworth Dr
- 8017 Dartworth Dr
- 8119 Dartworth Dr
- 6005 Chestnut Hills Dr
- 8101 Thornton Dr
- 8025 Thornton Dr
- 8103 Thornton Dr
- 8008 Thornton Dr
- 5993 Chestnut Hills Dr
- 8021 Thornton Dr
- 8013 Dartworth Dr
- 8123 Dartworth Dr