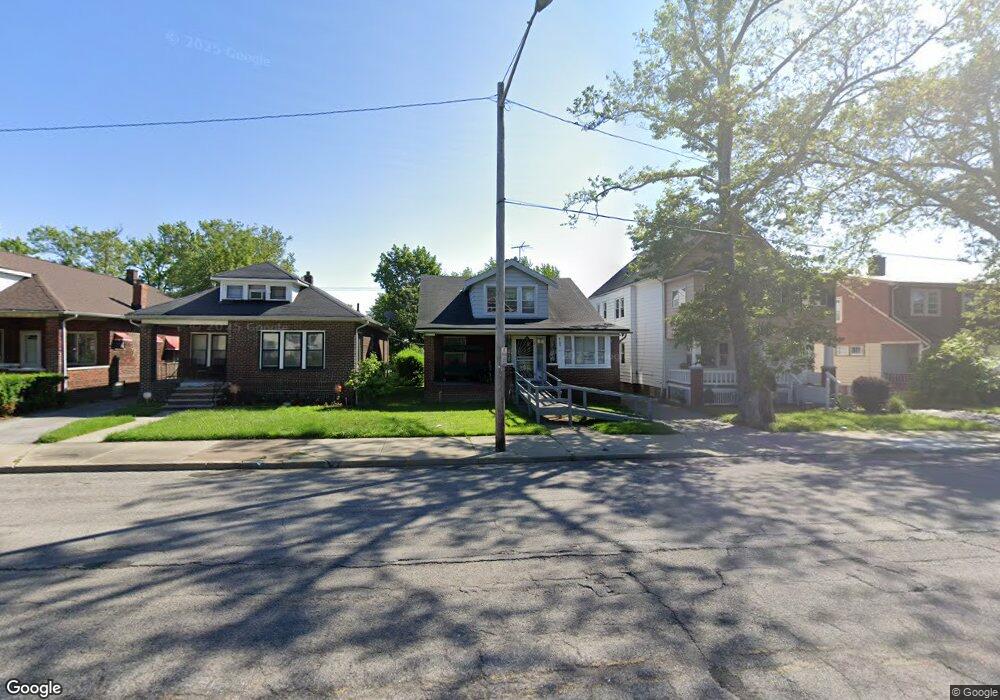
8108 Garfield Blvd Cleveland, OH 44125
Estimated Value: $123,000 - $173,000
3
Beds
1
Bath
1,783
Sq Ft
$77/Sq Ft
Est. Value
About This Home
This home is located at 8108 Garfield Blvd, Cleveland, OH 44125 and is currently estimated at $137,065, approximately $76 per square foot. 8108 Garfield Blvd is a home located in Cuyahoga County with nearby schools including Garfield Heights High School, North Shore High School, and Holy Name Elementary School.
Ownership History
Date
Name
Owned For
Owner Type
Purchase Details
Closed on
Jun 7, 2018
Sold by
Gilner Devvie
Bought by
White Stafford
Current Estimated Value
Purchase Details
Closed on
Oct 24, 2000
Sold by
Fuhs Halina M
Bought by
Gilner Devvie L
Home Financials for this Owner
Home Financials are based on the most recent Mortgage that was taken out on this home.
Original Mortgage
$79,652
Interest Rate
7.9%
Mortgage Type
FHA
Purchase Details
Closed on
Aug 18, 1987
Sold by
Alfreda Sikorski
Bought by
Fuhs Halina M
Purchase Details
Closed on
Jan 20, 1981
Sold by
Sikorski Alfreda
Bought by
Alfreda Sikorski
Purchase Details
Closed on
Dec 31, 1980
Sold by
Sikorski Fred and Sikorski Alfreda
Bought by
Sikorski Alfreda
Purchase Details
Closed on
Jan 1, 1975
Bought by
Sikorski Fred and Sikorski Alfreda
Create a Home Valuation Report for This Property
The Home Valuation Report is an in-depth analysis detailing your home's value as well as a comparison with similar homes in the area
Home Values in the Area
Average Home Value in this Area
Purchase History
| Date | Buyer | Sale Price | Title Company |
|---|---|---|---|
| White Stafford | -- | None Available | |
| Gilner Devvie L | $82,900 | Executive Title Agency Corp | |
| Fuhs Halina M | -- | -- | |
| Alfreda Sikorski | -- | -- | |
| Sikorski Alfreda | -- | -- | |
| Sikorski Fred | -- | -- |
Source: Public Records
Mortgage History
| Date | Status | Borrower | Loan Amount |
|---|---|---|---|
| Previous Owner | Gilner Devvie L | $79,652 | |
| Closed | Gilner Devvie L | $7,500 |
Source: Public Records
Tax History Compared to Growth
Tax History
| Year | Tax Paid | Tax Assessment Tax Assessment Total Assessment is a certain percentage of the fair market value that is determined by local assessors to be the total taxable value of land and additions on the property. | Land | Improvement |
|---|---|---|---|---|
| 2024 | $4,547 | $44,905 | $7,490 | $37,415 |
| 2023 | $3,113 | $28,040 | $5,430 | $22,610 |
| 2022 | $3,069 | $28,040 | $5,430 | $22,610 |
| 2021 | $3,243 | $28,040 | $5,430 | $22,610 |
| 2020 | $2,788 | $22,440 | $4,340 | $18,100 |
| 2019 | $2,762 | $64,100 | $12,400 | $51,700 |
| 2018 | $2,704 | $22,440 | $4,340 | $18,100 |
| 2017 | $2,659 | $20,160 | $3,430 | $16,730 |
| 2016 | $2,697 | $20,160 | $3,430 | $16,730 |
| 2015 | $2,971 | $20,160 | $3,430 | $16,730 |
| 2014 | $2,971 | $24,610 | $4,200 | $20,410 |
Source: Public Records
Map
Nearby Homes
- 4699 Burleigh Rd
- 8304 Garfield Blvd
- 4633 Warner Rd
- 4695 E 85th St
- 0 Grand Division Ave
- 8027 Grand Division Ave
- 4840 E 84th St
- 4646 E 86th St
- 4821 E 85th St
- 4684 E 88th St
- 8115 Bancroft Ave
- 8209 Bancroft Ave
- 4815 E 86th St
- 4665 E 88th St
- 4762 E 90th St
- 4888 E 85th St
- 4729 E 90th St
- 4769 E 90th St
- 7606 Vineyard Ave
- 4909 E 85th St
- 8104 Garfield Blvd
- 8112 Garfield Blvd
- 8100 Garfield Blvd
- 8116 Garfield Blvd
- 8032 Garfield Blvd
- 4723 Horton Rd
- 4742 Burleigh Rd
- 4727 Horton Rd
- 4748 Burleigh Rd
- 4733 Horton Rd
- 8109 Garfield Blvd
- 8196 Garfield Blvd
- 8022 Garfield Blvd
- 8113 Garfield Blvd
- 8113 Garfield Blvd Unit 1/DN
- 8113 Garfield Blvd Unit 1/2
- 8113 Garfield Blvd Unit 2/UP
- 8105 Garfield Blvd
- 4752 Burleigh Rd
- 8117 Garfield Blvd