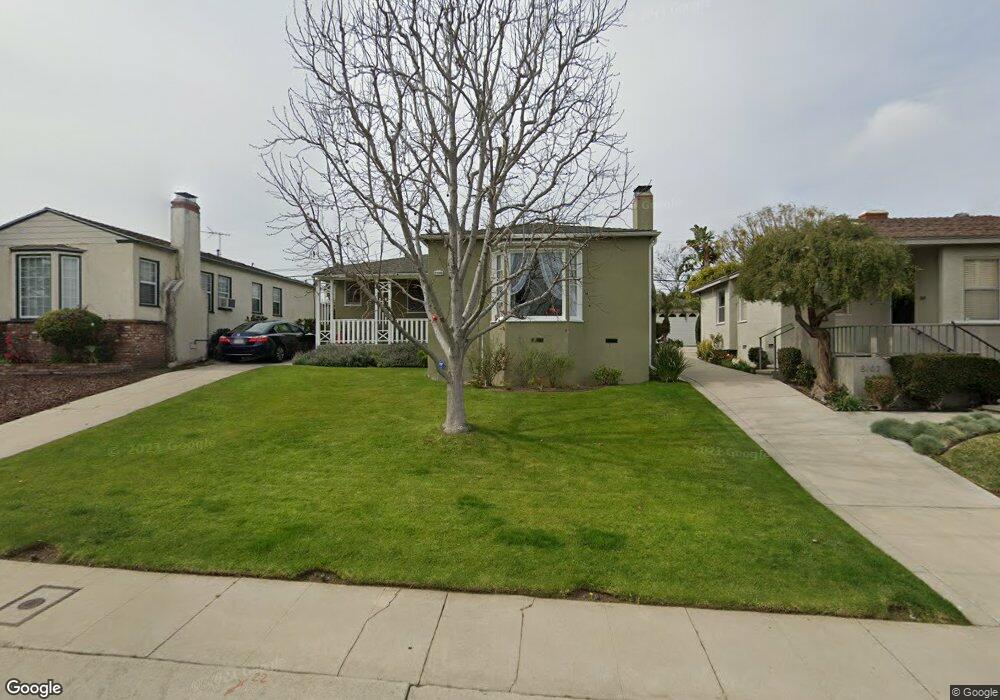
8111 Yorktown Ave Los Angeles, CA 90045
Westchester NeighborhoodEstimated Value: $1,534,297 - $1,596,000
3
Beds
2
Baths
1,621
Sq Ft
$972/Sq Ft
Est. Value
About This Home
This home is located at 8111 Yorktown Ave, Los Angeles, CA 90045 and is currently estimated at $1,576,074, approximately $972 per square foot. 8111 Yorktown Ave is a home located in Los Angeles County with nearby schools including Westport Heights Elementary, Wright Middle School STEAM Magnet, and Westchester Enriched Sciences Magnets.
Ownership History
Date
Name
Owned For
Owner Type
Purchase Details
Closed on
Mar 19, 2024
Sold by
Totally Legit Real Estate Holdings Llc
Bought by
Mark J And Carolyn E Sieve Family Trust and Sieve
Current Estimated Value
Purchase Details
Closed on
Dec 28, 2018
Sold by
Enciso Sieve Mark Joseph and Enciso Sieve Carolyn
Bought by
Totally Legit Real Estate Holdings Llc
Purchase Details
Closed on
Feb 11, 2012
Sold by
Sieve Mark and Sieve Carolyn
Bought by
Sieve Mark Joseph and Sieve Carolyn Enciso
Purchase Details
Closed on
Feb 4, 2003
Sold by
Dugre Robert M and Dugre Patricia A
Bought by
Sieve Mark
Home Financials for this Owner
Home Financials are based on the most recent Mortgage that was taken out on this home.
Original Mortgage
$391,200
Interest Rate
5.87%
Create a Home Valuation Report for This Property
The Home Valuation Report is an in-depth analysis detailing your home's value as well as a comparison with similar homes in the area
Home Values in the Area
Average Home Value in this Area
Purchase History
| Date | Buyer | Sale Price | Title Company |
|---|---|---|---|
| Mark J And Carolyn E Sieve Family Trust | -- | None Listed On Document | |
| Totally Legit Real Estate Holdings Llc | -- | None Available | |
| Sieve Mark Joseph | -- | None Available | |
| Sieve Mark | $489,000 | Southland Title Corporation |
Source: Public Records
Mortgage History
| Date | Status | Borrower | Loan Amount |
|---|---|---|---|
| Previous Owner | Sieve Mark | $391,200 | |
| Closed | Sieve Mark | $97,800 |
Source: Public Records
Tax History Compared to Growth
Tax History
| Year | Tax Paid | Tax Assessment Tax Assessment Total Assessment is a certain percentage of the fair market value that is determined by local assessors to be the total taxable value of land and additions on the property. | Land | Improvement |
|---|---|---|---|---|
| 2025 | $8,655 | $708,216 | $566,581 | $141,635 |
| 2024 | $8,655 | $694,330 | $555,472 | $138,858 |
| 2023 | $8,494 | $680,717 | $544,581 | $136,136 |
| 2022 | $8,106 | $667,370 | $533,903 | $133,467 |
| 2021 | $8,002 | $654,285 | $523,435 | $130,850 |
| 2020 | $8,082 | $647,577 | $518,068 | $129,509 |
| 2019 | $7,766 | $634,880 | $507,910 | $126,970 |
| 2018 | $7,673 | $622,432 | $497,951 | $124,481 |
| 2016 | $7,334 | $598,265 | $478,616 | $119,649 |
| 2015 | $7,228 | $589,279 | $471,427 | $117,852 |
| 2014 | $7,173 | $577,737 | $462,193 | $115,544 |
Source: Public Records
Map
Nearby Homes
- 7840 Boeing Ave
- 7832 Bleriot Ave
- 7842 Croydon Ave
- 8312 Barnsley Ave
- 8332 Barnsley Ave
- 6007 W 86th Place
- 8101 Naylor Ave
- 8210 Alverstone Ave
- 8734 Airlane Ave
- 8512 Belford Ave
- 8620 Belford Ave Unit 608
- 8620 Belford Ave Unit 604
- 5966 Abernathy Dr
- 7803 Flight Ave
- 8815 Glider Ave
- 6040 W 76th St
- 8831 Glider Ave
- 8906 Yorktown Ave
- 5988 W 76th St
- 6322 W 78th Place
- 8107 Yorktown Ave
- 8117 Yorktown Ave
- 8101 Yorktown Ave
- 8128 Airlane Ave
- 8122 Airlane Ave
- 8132 Airlane Ave
- 8027 Yorktown Ave
- 8118 Airlane Ave
- 8110 Yorktown Ave
- 8106 Yorktown Ave
- 8116 Yorktown Ave
- 8100 Yorktown Ave
- 6024 W 82nd St
- 8021 Yorktown Ave
- 6020 W 82nd St
- 6018 W 82nd St
- 6026 W 82nd St
- 8026 Yorktown Ave
- 8106 Airlane Ave
- 6014 W 82nd St