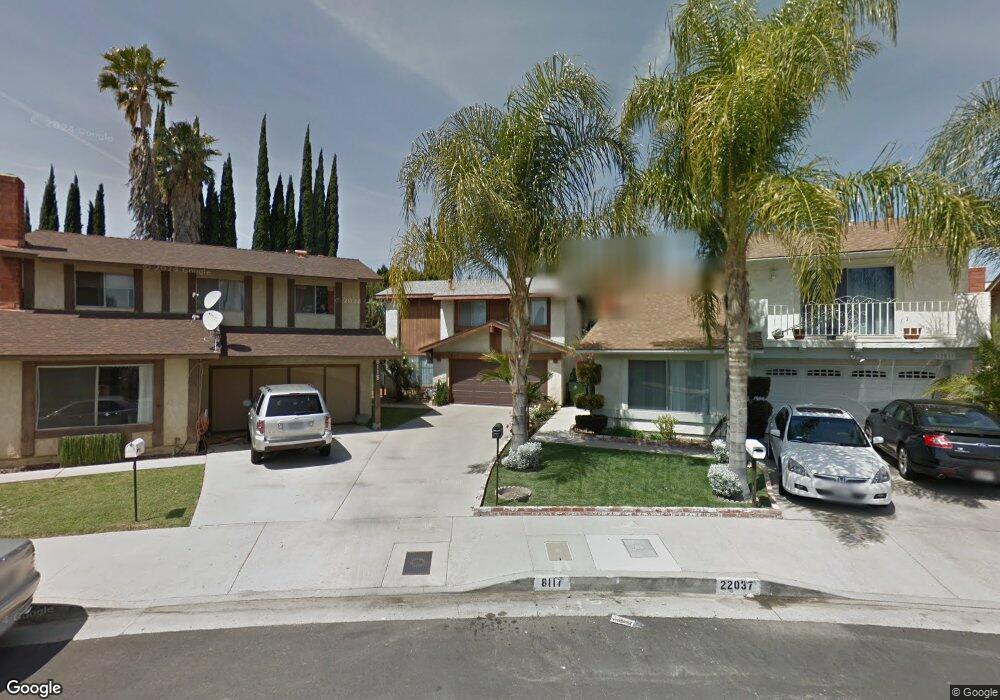
8117 Hanna Ave Canoga Park, CA 91304
Canoga Park NeighborhoodEstimated Value: $636,000 - $725,000
3
Beds
3
Baths
1,447
Sq Ft
$463/Sq Ft
Est. Value
About This Home
This home is located at 8117 Hanna Ave, Canoga Park, CA 91304 and is currently estimated at $670,245, approximately $463 per square foot. 8117 Hanna Ave is a home located in Los Angeles County with nearby schools including Capistrano Avenue Elementary School, Christopher Columbus Middle School, and Canoga Park Senior High School.
Ownership History
Date
Name
Owned For
Owner Type
Purchase Details
Closed on
Nov 11, 2010
Sold by
Samson Alex D and Samson Patricia L
Bought by
Samson Alex D and Samson Patricia L
Current Estimated Value
Purchase Details
Closed on
Mar 12, 2002
Sold by
Samson Alex and Samson Maria Dolores
Bought by
Samson Alex
Home Financials for this Owner
Home Financials are based on the most recent Mortgage that was taken out on this home.
Original Mortgage
$130,000
Interest Rate
6.99%
Purchase Details
Closed on
Nov 7, 1998
Sold by
Samson Maria Dolores
Bought by
Samson Alex
Purchase Details
Closed on
Jul 21, 1995
Sold by
Tran Kiem Thuc and Nguyen Thi Tuong Giang
Bought by
Samson Alex and Samson Maria Dolores
Home Financials for this Owner
Home Financials are based on the most recent Mortgage that was taken out on this home.
Original Mortgage
$140,400
Interest Rate
7.63%
Create a Home Valuation Report for This Property
The Home Valuation Report is an in-depth analysis detailing your home's value as well as a comparison with similar homes in the area
Home Values in the Area
Average Home Value in this Area
Purchase History
| Date | Buyer | Sale Price | Title Company |
|---|---|---|---|
| Samson Alex D | -- | None Available | |
| Samson Alex D | -- | None Available | |
| Samson Alex | -- | American Title Co | |
| Samson Alex | $156,000 | -- | |
| Samson Alex | $156,000 | American Coast Title |
Source: Public Records
Mortgage History
| Date | Status | Borrower | Loan Amount |
|---|---|---|---|
| Closed | Samson Alex | $130,000 | |
| Previous Owner | Samson Alex | $140,400 |
Source: Public Records
Tax History Compared to Growth
Tax History
| Year | Tax Paid | Tax Assessment Tax Assessment Total Assessment is a certain percentage of the fair market value that is determined by local assessors to be the total taxable value of land and additions on the property. | Land | Improvement |
|---|---|---|---|---|
| 2025 | $3,256 | $259,123 | $95,504 | $163,619 |
| 2024 | $3,256 | $254,043 | $93,632 | $160,411 |
| 2023 | $3,196 | $249,063 | $91,797 | $157,266 |
| 2022 | $3,051 | $244,181 | $89,998 | $154,183 |
| 2021 | $3,007 | $239,394 | $88,234 | $151,160 |
| 2019 | $2,918 | $232,296 | $85,618 | $146,678 |
| 2018 | $2,824 | $227,742 | $83,940 | $143,802 |
| 2016 | $2,684 | $218,901 | $80,682 | $138,219 |
| 2015 | $2,645 | $215,614 | $79,471 | $136,143 |
| 2014 | $2,659 | $211,392 | $77,915 | $133,477 |
Source: Public Records
Map
Nearby Homes
- 22128 Burton St
- 7934 Vassar Ave
- 7845 Nevada Ave
- 7826 Topanga Unit 213
- 22158 Elkwood St
- 7826 Topanga Canyon Blvd Unit 218
- 7826 Topanga Canyon Blvd Unit 301
- 7826 Topanga Canyon Blvd Unit 231
- 22151 Ingomar St
- 22345 Cantara St
- 22115 Hackney St
- 7800 Topanga Canyon Blvd Unit 208
- 7957 Sausalito Ave
- 7816 Shoup Ave
- 7749 Nita Ave
- 7650 Topanga Canyon Blvd Unit 14
- 7845 Sausalito Ave
- 8515 Eatough Place
- 7725 Owensmouth Ave
- 22022 Malden St
- 22037 Cantara St Unit 57
- 22037 Cantara St
- 8115 Hanna Ave
- 8109 Hanna Ave
- 22033 Cantara St
- 8118 Glade Ave
- 22030 Cantara St Unit 41
- 8120 Glade Ave
- 22025 Cantara St Unit 54
- 22029 Cantara St
- 22025 Cantara St
- 8110 Glade Ave
- 8005 Hanna Ave Unit 71
- 8001 Hanna Ave
- 8005 Hanna Ave
- 8009 Hanna Ave
- 8031 Hanna Ave
- 8101 Hanna Ave
- 22017 Cantara St
- 22005 Cantara St