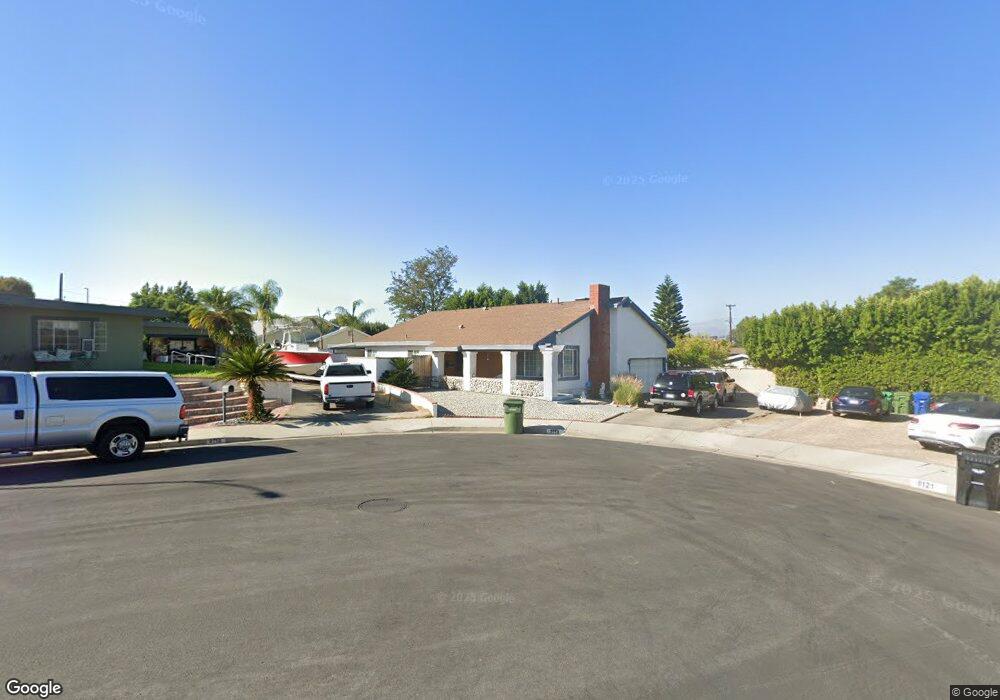
8118 Brownstone St Sunland, CA 91040
Sunland NeighborhoodEstimated Value: $876,736 - $1,324,000
4
Beds
2
Baths
1,664
Sq Ft
$648/Sq Ft
Est. Value
About This Home
This home is located at 8118 Brownstone St, Sunland, CA 91040 and is currently estimated at $1,078,684, approximately $648 per square foot. 8118 Brownstone St is a home located in Los Angeles County with nearby schools including Sunland Elementary School, Mt. Gleason Middle School, and Verdugo Hills Senior High School.
Ownership History
Date
Name
Owned For
Owner Type
Purchase Details
Closed on
Jul 31, 2000
Sold by
Elizabeth J Reeves James F and Elizabeth J Reeves
Bought by
Morrison Paul T and Morrison Susan B
Current Estimated Value
Home Financials for this Owner
Home Financials are based on the most recent Mortgage that was taken out on this home.
Original Mortgage
$170,000
Outstanding Balance
$61,161
Interest Rate
8.11%
Estimated Equity
$1,017,523
Purchase Details
Closed on
Jun 17, 1998
Sold by
Reeves James Francis
Bought by
Reeves James Francis and Montana Reeves Elizabeth Joanne
Purchase Details
Closed on
Apr 30, 1996
Sold by
Greenwood John and Greenwood Cheryl
Bought by
Reeves James Frances
Home Financials for this Owner
Home Financials are based on the most recent Mortgage that was taken out on this home.
Original Mortgage
$137,750
Interest Rate
7.97%
Create a Home Valuation Report for This Property
The Home Valuation Report is an in-depth analysis detailing your home's value as well as a comparison with similar homes in the area
Home Values in the Area
Average Home Value in this Area
Purchase History
| Date | Buyer | Sale Price | Title Company |
|---|---|---|---|
| Morrison Paul T | $269,000 | Old Republic Title | |
| Reeves James Francis | -- | -- | |
| Reeves James Frances | $145,000 | Fidelity Title |
Source: Public Records
Mortgage History
| Date | Status | Borrower | Loan Amount |
|---|---|---|---|
| Open | Morrison Paul T | $170,000 | |
| Previous Owner | Reeves James Frances | $137,750 |
Source: Public Records
Tax History Compared to Growth
Tax History
| Year | Tax Paid | Tax Assessment Tax Assessment Total Assessment is a certain percentage of the fair market value that is determined by local assessors to be the total taxable value of land and additions on the property. | Land | Improvement |
|---|---|---|---|---|
| 2025 | $5,021 | $405,316 | $196,482 | $208,834 |
| 2024 | $5,021 | $397,370 | $192,630 | $204,740 |
| 2023 | $4,927 | $389,579 | $188,853 | $200,726 |
| 2022 | $4,702 | $381,941 | $185,150 | $196,791 |
| 2021 | $4,638 | $374,453 | $181,520 | $192,933 |
| 2019 | $4,501 | $363,348 | $176,137 | $187,211 |
| 2018 | $4,413 | $356,225 | $172,684 | $183,541 |
| 2016 | $4,204 | $342,395 | $165,980 | $176,415 |
| 2015 | $4,144 | $337,253 | $163,487 | $173,766 |
| 2014 | $4,163 | $330,648 | $160,285 | $170,363 |
Source: Public Records
Map
Nearby Homes
- 8110 Brownstone St
- 11034 Scoville Ave
- 12159 Oro Vista Ave
- 11009 Quill Ave
- 7848 Forsythe St
- 0 Rim Canyon Rd Unit SR25228396
- 8230 Hillrose St
- 7844 Rim Canyon Rd
- 10704 Oro Vista Ave
- 7815 Denivelle Rd
- 7755 Forsythe St
- 10623 Woodward Ave
- 8545 Forsythe St
- 7851 Fenwick St
- 10799 Sherman Grove Ave
- 10799 Sherman Grove Ave Unit 18
- 10799 Sherman Grove Ave Unit 61
- 8421 Grenoble St
- 10711 Sherman Grove Ave Unit 26
- 10711 Sherman Grove Ave Unit 13
- 11018 Nassau Ave
- 11014 Nassau Ave
- 8121 Brownstone St
- 11024 Nassau Ave
- 8135 Graystone St
- 8113 Brownstone St
- 11030 Nassau Ave
- 8100 Brownstone St
- 8103 Brownstone St
- 11001 Langmuir Ave
- 11034 Nassau Ave
- 11035 Langmuir Ave
- 11013 Nassau Ave
- 11019 Nassau Ave
- 11042 Nassau Ave
- 8118 Graystone St
- 11025 Nassau Ave
- 11007 Nassau Ave
- 8138 Graystone St
- 11031 Nassau Ave