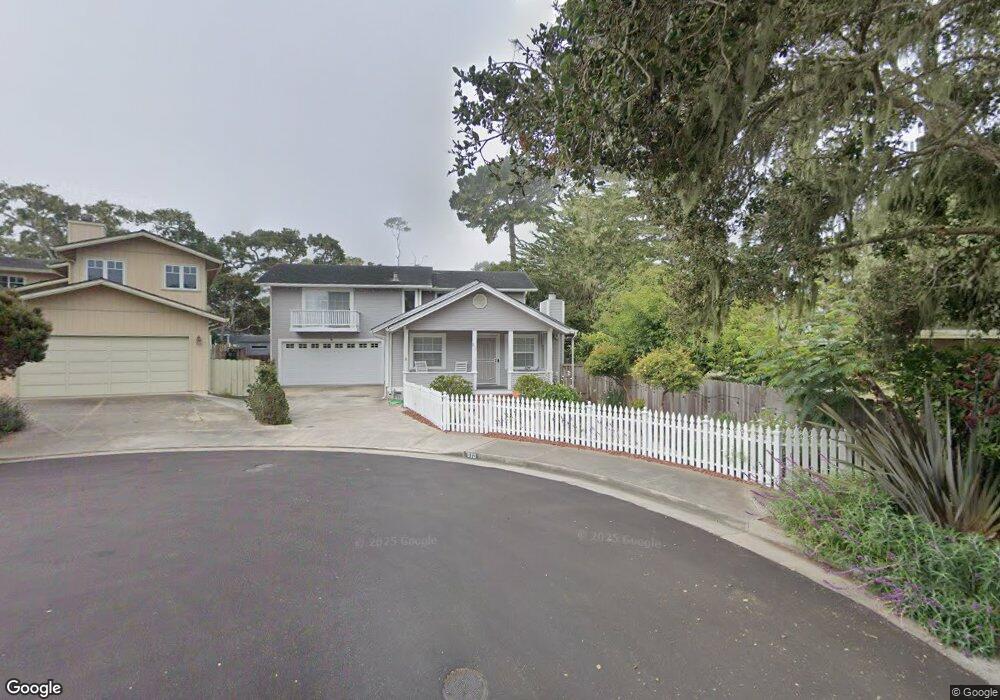
813 Day Cir Pacific Grove, CA 93950
Estimated Value: $1,615,000 - $2,027,699
3
Beds
3
Baths
2,122
Sq Ft
$857/Sq Ft
Est. Value
About This Home
This home is located at 813 Day Cir, Pacific Grove, CA 93950 and is currently estimated at $1,817,675, approximately $856 per square foot. 813 Day Cir is a home located in Monterey County with nearby schools including Forest Grove Elementary School, Pacific Grove Middle School, and Pacific Grove High School.
Ownership History
Date
Name
Owned For
Owner Type
Purchase Details
Closed on
Nov 17, 2017
Sold by
Payne Roger and Payne Patricia
Bought by
Payne Roger and Payne Patricia
Current Estimated Value
Home Financials for this Owner
Home Financials are based on the most recent Mortgage that was taken out on this home.
Original Mortgage
$954,225
Outstanding Balance
$820,725
Interest Rate
4.9%
Mortgage Type
Reverse Mortgage Home Equity Conversion Mortgage
Estimated Equity
$996,950
Purchase Details
Closed on
Aug 11, 2016
Sold by
Payne Roger W and Payne Patricia A
Bought by
Payne Roger and Payne Patricia
Purchase Details
Closed on
Jun 10, 1997
Sold by
Day James Paul and Day Patricia
Bought by
Payne Roger W and Payne Patricia A
Home Financials for this Owner
Home Financials are based on the most recent Mortgage that was taken out on this home.
Original Mortgage
$240,000
Interest Rate
7.94%
Create a Home Valuation Report for This Property
The Home Valuation Report is an in-depth analysis detailing your home's value as well as a comparison with similar homes in the area
Home Values in the Area
Average Home Value in this Area
Purchase History
| Date | Buyer | Sale Price | Title Company |
|---|---|---|---|
| Payne Roger | -- | First American Title Company | |
| Payne Roger | -- | None Available | |
| Payne Roger W | $350,000 | Stewart Title |
Source: Public Records
Mortgage History
| Date | Status | Borrower | Loan Amount |
|---|---|---|---|
| Open | Payne Roger | $954,225 | |
| Closed | Payne Roger W | $240,000 |
Source: Public Records
Tax History Compared to Growth
Tax History
| Year | Tax Paid | Tax Assessment Tax Assessment Total Assessment is a certain percentage of the fair market value that is determined by local assessors to be the total taxable value of land and additions on the property. | Land | Improvement |
|---|---|---|---|---|
| 2025 | $5,910 | $570,003 | $350,149 | $219,854 |
| 2024 | $5,910 | $558,828 | $343,284 | $215,544 |
| 2023 | $6,051 | $547,871 | $336,553 | $211,318 |
| 2022 | $5,928 | $537,129 | $329,954 | $207,175 |
| 2021 | $5,897 | $526,598 | $323,485 | $203,113 |
| 2020 | $5,779 | $521,200 | $320,169 | $201,031 |
| 2019 | $5,596 | $510,982 | $313,892 | $197,090 |
| 2018 | $5,485 | $500,964 | $307,738 | $193,226 |
| 2017 | $5,396 | $491,142 | $301,704 | $189,438 |
| 2016 | $5,407 | $481,513 | $295,789 | $185,724 |
| 2015 | $5,319 | $474,281 | $291,346 | $182,935 |
| 2014 | $5,208 | $464,991 | $285,639 | $179,352 |
Source: Public Records
Map
Nearby Homes
- 765 Gibson Ave
- 791 Spruce Ave
- 700 Rosemont Ave
- 311 Walnut St
- 820 - 822 Cedar St
- 311 Lobos Ave
- 309 Congress Ave
- 618 Forest Ave
- 52 Country Club Gate
- 302 Park St
- 222 Wood St
- 304 Grove Acre Ave
- 38 Country Club Gate
- 64 Spanish Bay Cir
- 206 Cypress Ave Unit B
- 917 Fountain Ave
- 616 Sage Ct
- 224 16th St
- 605 Acorn Ct
- 1007 Brentwood Ct