8136 S Avalon Ave Chicago, IL 60619
Grand Crossing NeighborhoodEstimated Value: $138,000 - $292,000
2
Beds
1
Bath
1,035
Sq Ft
$179/Sq Ft
Est. Value
About This Home
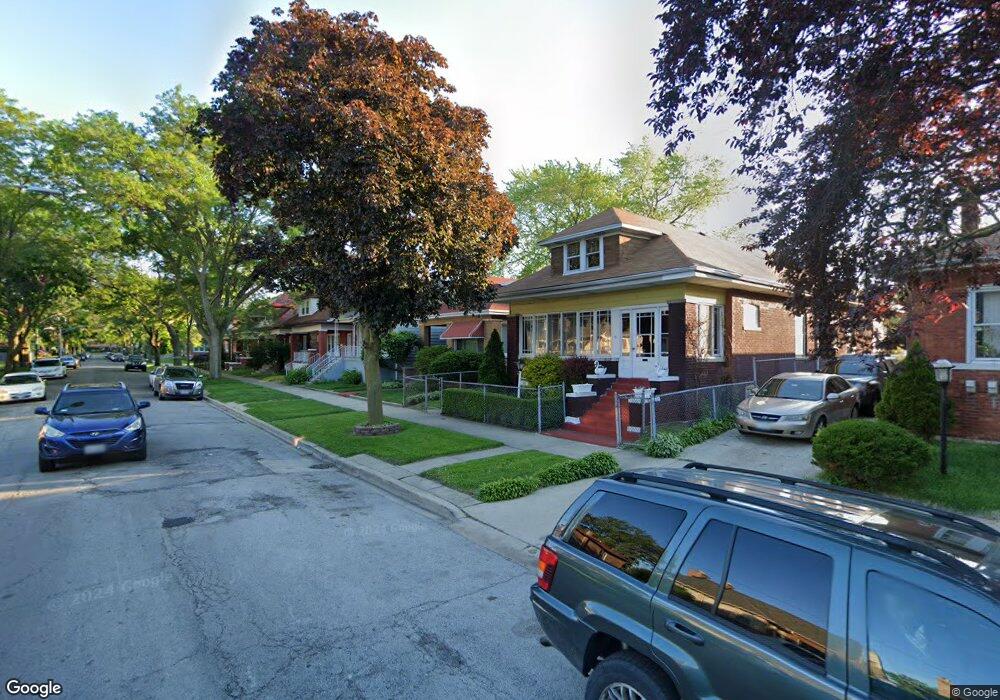
This home is located at 8136 S Avalon Ave, Chicago, IL 60619 and is currently estimated at $185,420, approximately $179 per square foot. 8136 S Avalon Ave is a home located in Cook County with nearby schools including Emil G. Hirsch Metropolitan High School, Betty Shabazz Academy, and CICS Avalon.
Ownership History
Date
Name
Owned For
Owner Type
Purchase Details
Closed on
Feb 29, 2024
Sold by
Arcel Investments Inc and Jd Solutions Llc
Bought by
Shogbuyi Taofiq Olayinka
Current Estimated Value
Purchase Details
Closed on
Aug 17, 2020
Sold by
Nr Deed Llc
Bought by
Jd Solution Llc
Purchase Details
Closed on
Jan 10, 2019
Sold by
County Of Cook
Bought by
Nr Deed Llc
Purchase Details
Closed on
Jul 10, 2006
Sold by
Whitehorn Shirino
Bought by
Motley Shannon
Purchase Details
Closed on
Feb 16, 2004
Sold by
Whitehorn Barbara
Bought by
Whitehorn Barbara and Whitehorn Shirino
Purchase Details
Closed on
Oct 3, 1997
Sold by
Cole Taylor Bank
Bought by
Whitehorn Barbara
Home Financials for this Owner
Home Financials are based on the most recent Mortgage that was taken out on this home.
Original Mortgage
$50,150
Interest Rate
11.74%
Create a Home Valuation Report for This Property
The Home Valuation Report is an in-depth analysis detailing your home's value as well as a comparison with similar homes in the area
Home Values in the Area
Average Home Value in this Area
Purchase History
| Date | Buyer | Sale Price | Title Company |
|---|---|---|---|
| Shogbuyi Taofiq Olayinka | -- | None Listed On Document | |
| Jd Solution Llc | $28,000 | Greater Illinois Title Co | |
| Nr Deed Llc | -- | None Available | |
| Motley Shannon | -- | None Available | |
| Whitehorn Barbara | -- | -- | |
| Whitehorn Barbara | -- | -- |
Source: Public Records
Mortgage History
| Date | Status | Borrower | Loan Amount |
|---|---|---|---|
| Previous Owner | Whitehorn Barbara | $50,150 |
Source: Public Records
Tax History Compared to Growth
Tax History
| Year | Tax Paid | Tax Assessment Tax Assessment Total Assessment is a certain percentage of the fair market value that is determined by local assessors to be the total taxable value of land and additions on the property. | Land | Improvement |
|---|---|---|---|---|
| 2024 | $1,055 | $10,401 | $2,288 | $8,113 |
| 2023 | $1,028 | $5,001 | $3,813 | $1,188 |
| 2022 | $1,028 | $5,001 | $3,813 | $1,188 |
| 2021 | $1,005 | $4,999 | $3,812 | $1,187 |
| 2020 | $1,851 | $11,412 | $2,745 | $8,667 |
| 2019 | $1,859 | $12,680 | $2,745 | $9,935 |
| 2018 | $1,826 | $12,680 | $2,745 | $9,935 |
| 2017 | $1,549 | $10,569 | $2,440 | $8,129 |
| 2016 | $1,617 | $10,569 | $2,440 | $8,129 |
| 2015 | $1,456 | $10,569 | $2,440 | $8,129 |
| 2014 | $1,445 | $10,359 | $2,135 | $8,224 |
| 2013 | $1,406 | $10,359 | $2,135 | $8,224 |
Source: Public Records
Map
Nearby Homes
- 8055 S Avalon Ave
- 8101 S Kimbark Ave
- 8048 S Avalon Ave
- 8227 S Avalon Ave
- 1129 E 81st St
- 8007 S Avalon Ave
- 1130 E 81st St Unit A
- 8235 S Woodlawn Ave
- 7521 S Kimbark Ave
- 8250 S Kenwood Ave
- 1117 E 82nd Place
- 1059 E 80th St
- 8106 S Dobson Ave
- 8036 S Dobson Ave
- 1133 E 83rd St Unit 177
- 8041 S Blackstone Ave
- 8035 S Blackstone Ave
- 8106 S Harper Ave
- 8138 S Harper Ave
- 8200 S Harper Ave
- 8132 S Avalon Ave
- 8128 S Avalon Ave
- 8142 S Avalon Ave
- 8146 S Avalon Ave
- 8126 S Avalon Ave
- 8148 S Avalon Ave
- 8137 S Woodlawn Ave
- 8133 S Woodlawn Ave
- 8141 S Woodlawn Ave
- 8122 S Avalon Ave
- 8129 S Woodlawn Ave
- 8143 S Woodlawn Ave
- 8147 S Woodlawn Ave
- 8127 S Woodlawn Ave
- 8133 S Avalon Ave
- 8114 S Avalon Ave
- 8149 S Woodlawn Ave
- 8137 S Avalon Ave
- 8139 S Avalon Ave
- 8141 S Avalon Ave