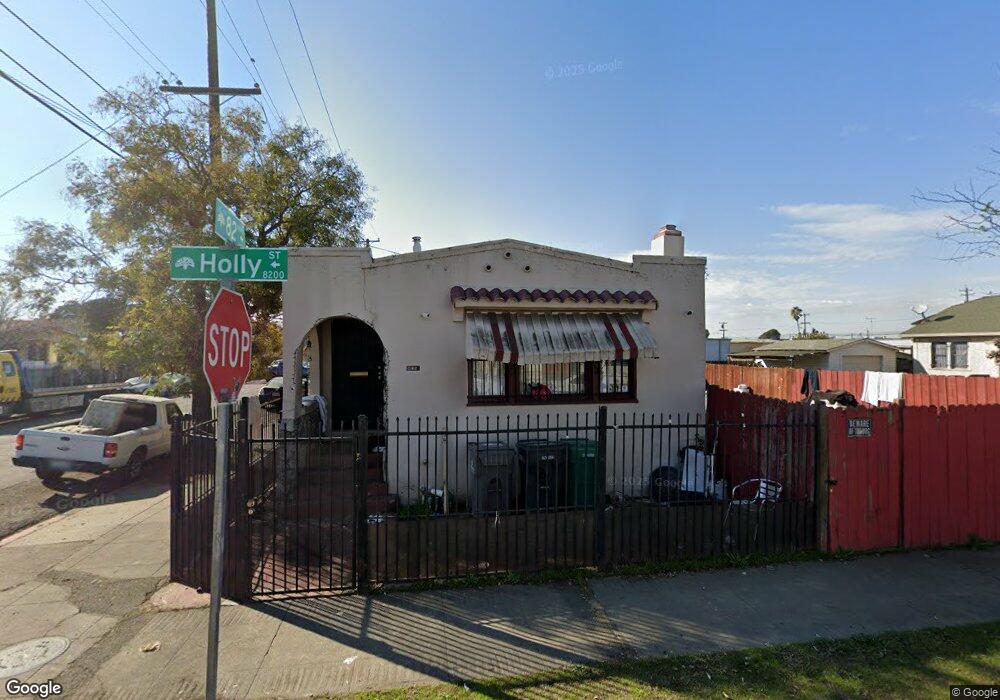
8139 Holly St Oakland, CA 94621
Arroyo Viejo NeighborhoodEstimated Value: $463,623 - $592,000
4
Beds
2
Baths
1,422
Sq Ft
$361/Sq Ft
Est. Value
About This Home
This home is located at 8139 Holly St, Oakland, CA 94621 and is currently estimated at $513,406, approximately $361 per square foot. 8139 Holly St is a home located in Alameda County with nearby schools including East Oakland Pride Elementary School, Greenleaf TK-8, and Coliseum College Prep Academy.
Ownership History
Date
Name
Owned For
Owner Type
Purchase Details
Closed on
Jan 23, 2014
Sold by
Majail Iris Yolanda and Majail Yolanda
Bought by
The 2014 Yolanda Olano Majail & Rolando
Current Estimated Value
Purchase Details
Closed on
Jan 12, 2011
Sold by
Federal National Mortgage Association
Bought by
Majail Iris Yolanda
Purchase Details
Closed on
Sep 3, 2010
Sold by
Carillo Hector Rugerio and Avalos Teresa Rugerio
Bought by
Fannie Mae and Federal National Mortgage Association
Purchase Details
Closed on
Oct 6, 2004
Sold by
White Dovie and Estate Of John D Morris
Bought by
Carrillo Hector Rugerio and Avalos Teresa Rugerio
Home Financials for this Owner
Home Financials are based on the most recent Mortgage that was taken out on this home.
Original Mortgage
$208,000
Interest Rate
5.5%
Mortgage Type
Purchase Money Mortgage
Create a Home Valuation Report for This Property
The Home Valuation Report is an in-depth analysis detailing your home's value as well as a comparison with similar homes in the area
Home Values in the Area
Average Home Value in this Area
Purchase History
| Date | Buyer | Sale Price | Title Company |
|---|---|---|---|
| The 2014 Yolanda Olano Majail & Rolando | -- | None Available | |
| Majail Iris Yolanda | $109,000 | Fidelity National Title Co | |
| Fannie Mae | $224,678 | Accommodation | |
| Carrillo Hector Rugerio | $260,000 | Alliance Title Company |
Source: Public Records
Mortgage History
| Date | Status | Borrower | Loan Amount |
|---|---|---|---|
| Previous Owner | Carrillo Hector Rugerio | $208,000 |
Source: Public Records
Tax History Compared to Growth
Tax History
| Year | Tax Paid | Tax Assessment Tax Assessment Total Assessment is a certain percentage of the fair market value that is determined by local assessors to be the total taxable value of land and additions on the property. | Land | Improvement |
|---|---|---|---|---|
| 2025 | $4,081 | $139,638 | $41,891 | $97,747 |
| 2024 | $4,081 | $136,902 | $41,070 | $95,832 |
| 2023 | $4,128 | $134,218 | $40,265 | $93,953 |
| 2022 | $3,879 | $131,587 | $39,476 | $92,111 |
| 2021 | $3,496 | $129,007 | $38,702 | $90,305 |
| 2020 | $3,454 | $127,685 | $38,305 | $89,380 |
| 2019 | $3,189 | $125,182 | $37,554 | $87,628 |
| 2018 | $3,126 | $122,728 | $36,818 | $85,910 |
| 2017 | $2,953 | $120,323 | $36,097 | $84,226 |
| 2016 | $2,776 | $117,964 | $35,389 | $82,575 |
| 2015 | $2,756 | $116,193 | $34,858 | $81,335 |
| 2014 | $2,936 | $113,917 | $34,175 | $79,742 |
Source: Public Records
Map
Nearby Homes