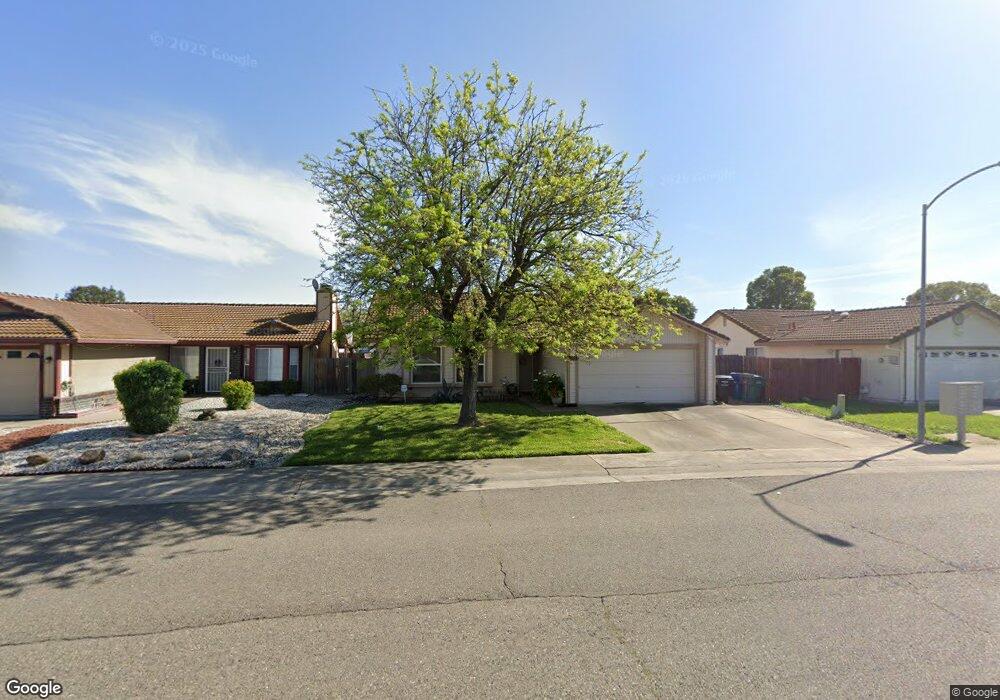
8152 Lenhart Rd Sacramento, CA 95828
Estimated Value: $226,000 - $419,662
3
Beds
2
Baths
1,232
Sq Ft
$300/Sq Ft
Est. Value
About This Home
This home is located at 8152 Lenhart Rd, Sacramento, CA 95828 and is currently estimated at $369,166, approximately $299 per square foot. 8152 Lenhart Rd is a home located in Sacramento County with nearby schools including Anna Kirchgater Elementary School, James Rutter Middle School, and Florin High School.
Ownership History
Date
Name
Owned For
Owner Type
Purchase Details
Closed on
Oct 20, 2014
Sold by
Torres Ruben J and Torres Julia P
Bought by
Perez Maricel M
Current Estimated Value
Purchase Details
Closed on
Nov 20, 2003
Sold by
Munoz Delia E
Bought by
Torres Ruben J and Torres Julia P
Home Financials for this Owner
Home Financials are based on the most recent Mortgage that was taken out on this home.
Original Mortgage
$169,000
Interest Rate
6%
Mortgage Type
Purchase Money Mortgage
Purchase Details
Closed on
Nov 20, 1998
Sold by
Wright Kerry Lynne
Bought by
Munoz Delia E
Home Financials for this Owner
Home Financials are based on the most recent Mortgage that was taken out on this home.
Original Mortgage
$108,310
Interest Rate
6.69%
Mortgage Type
FHA
Create a Home Valuation Report for This Property
The Home Valuation Report is an in-depth analysis detailing your home's value as well as a comparison with similar homes in the area
Home Values in the Area
Average Home Value in this Area
Purchase History
| Date | Buyer | Sale Price | Title Company |
|---|---|---|---|
| Perez Maricel M | -- | None Available | |
| Torres Ruben J | $219,000 | North American Title Co | |
| Munoz Delia E | $111,000 | Chicago Title Co | |
| Munoz Delia E | -- | Chicago Title Co |
Source: Public Records
Mortgage History
| Date | Status | Borrower | Loan Amount |
|---|---|---|---|
| Previous Owner | Torres Ruben J | $169,000 | |
| Previous Owner | Munoz Delia E | $108,310 |
Source: Public Records
Tax History Compared to Growth
Tax History
| Year | Tax Paid | Tax Assessment Tax Assessment Total Assessment is a certain percentage of the fair market value that is determined by local assessors to be the total taxable value of land and additions on the property. | Land | Improvement |
|---|---|---|---|---|
| 2025 | $2,768 | $246,369 | $60,089 | $186,280 |
| 2024 | $2,768 | $241,539 | $58,911 | $182,628 |
| 2023 | $2,700 | $236,804 | $57,756 | $179,048 |
| 2022 | $2,656 | $232,162 | $56,624 | $175,538 |
| 2021 | $2,628 | $227,611 | $55,514 | $172,097 |
| 2020 | $2,594 | $225,278 | $54,945 | $170,333 |
| 2019 | $2,549 | $220,862 | $53,868 | $166,994 |
| 2018 | $2,483 | $216,532 | $52,812 | $163,720 |
| 2017 | $2,441 | $212,287 | $51,777 | $160,510 |
| 2016 | $3,582 | $208,125 | $50,762 | $157,363 |
| 2015 | $3,462 | $205,000 | $50,000 | $155,000 |
| 2014 | $3,450 | $205,632 | $56,336 | $149,296 |
Source: Public Records
Map
Nearby Homes
- 7905 Springarden Way
- 4.13 ACR Lenhart Rd
- 8266 Summer Sunset Dr
- 8077 Goran Ct
- 8016 Stevenson Ave
- 8205 Weyburn Ct
- 7901 Stevenson Ave
- 8282 Union Creek Way
- 8186 Gustine Way
- 7711 Lenhart Rd
- 8346 Floxtree Ct
- 8336 Summer Sunset Dr
- 8095 E Stockton Blvd
- 0 Rangeview Ln
- 8013 Skywoods Way
- 8336 Cutler Way
- 7422 Sun Point Ln
- 8045 Arroyo Vista Dr
- 7956 Orchard Woods Cir
- 7724 La Bandera Way
- 8156 Lenhart Rd
- 8148 Lenhart Rd
- 8185 Speilberg Way
- 8181 Speilberg Way
- 8144 Lenhart Rd
- 8189 Speilberg Way
- 8160 Lenhart Rd
- 8177 Speilberg Way
- 7933 Roesboro Cir
- 8193 Speilberg Way
- 8140 Lenhart Rd
- 7944 Iona Way
- 8173 Speilberg Way
- 7929 Roesboro Cir
- 8136 Lenhart Rd
- 8169 Speilberg Way
- 8143 Lenhart Rd
- 8184 Speilberg Way
- 8180 Speilberg Way
- 7965 Iona Way