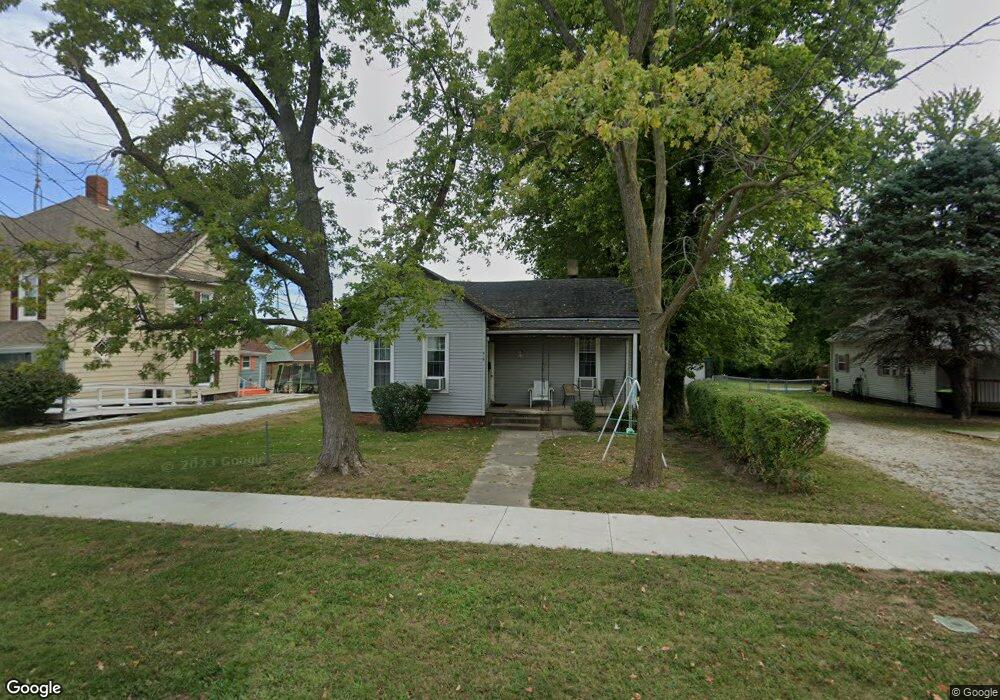
816 Hardin Ave Jacksonville, IL 62650
Estimated Value: $86,000 - $105,000
--
Bed
--
Bath
992
Sq Ft
$99/Sq Ft
Est. Value
About This Home
This home is located at 816 Hardin Ave, Jacksonville, IL 62650 and is currently estimated at $97,913, approximately $98 per square foot. 816 Hardin Ave is a home located in Morgan County with nearby schools including Jacksonville High School, Salem Lutheran School, and Salem Lutheran School.
Ownership History
Date
Name
Owned For
Owner Type
Purchase Details
Closed on
Jun 2, 2015
Sold by
Fox Susan D
Bought by
Roberts Fred C and Roberts Diane M
Current Estimated Value
Home Financials for this Owner
Home Financials are based on the most recent Mortgage that was taken out on this home.
Original Mortgage
$52,000
Interest Rate
3.63%
Mortgage Type
Future Advance Clause Open End Mortgage
Purchase Details
Closed on
Nov 29, 2012
Sold by
Fox Susan D and Fox Rodger L
Bought by
B & H Real Estate Ventures
Purchase Details
Closed on
Nov 22, 2005
Sold by
Sheehan David N and Sheehan Breanne Winkelman
Bought by
Fox Susan D
Home Financials for this Owner
Home Financials are based on the most recent Mortgage that was taken out on this home.
Original Mortgage
$356,513
Interest Rate
6.75%
Mortgage Type
Purchase Money Mortgage
Create a Home Valuation Report for This Property
The Home Valuation Report is an in-depth analysis detailing your home's value as well as a comparison with similar homes in the area
Home Values in the Area
Average Home Value in this Area
Purchase History
| Date | Buyer | Sale Price | Title Company |
|---|---|---|---|
| Roberts Fred C | $60,000 | None Available | |
| B & H Real Estate Ventures | $275,000 | None Available | |
| Fox Susan D | $40,000 | None Available |
Source: Public Records
Mortgage History
| Date | Status | Borrower | Loan Amount |
|---|---|---|---|
| Closed | Roberts Fred C | $52,000 | |
| Previous Owner | Fox Susan D | $356,513 |
Source: Public Records
Tax History Compared to Growth
Tax History
| Year | Tax Paid | Tax Assessment Tax Assessment Total Assessment is a certain percentage of the fair market value that is determined by local assessors to be the total taxable value of land and additions on the property. | Land | Improvement |
|---|---|---|---|---|
| 2024 | $2,040 | $23,450 | $3,070 | $20,380 |
| 2023 | $1,905 | $20,210 | $3,070 | $17,140 |
| 2022 | $1,910 | $20,050 | $3,070 | $16,980 |
| 2021 | $1,530 | $16,400 | $3,640 | $12,760 |
| 2020 | $1,561 | $16,400 | $3,640 | $12,760 |
| 2019 | $1,550 | $16,400 | $3,640 | $12,760 |
| 2018 | $1,483 | $16,270 | $3,640 | $12,630 |
| 2017 | $1,450 | $16,270 | $3,640 | $12,630 |
| 2016 | $1,465 | $16,270 | $3,640 | $12,630 |
| 2015 | $1,447 | $15,790 | $3,530 | $12,260 |
| 2014 | $1,447 | $15,790 | $3,530 | $12,260 |
| 2013 | $1,365 | $15,790 | $3,530 | $12,260 |
Source: Public Records
Map
Nearby Homes
- 727 Hardin Ave
- 544 Hardin Ave
- 333 Kentucky St
- 900 Bibbs St
- 352 Franklin St
- 800 S Main St
- 306 E Michigan Ave
- 729 S West St
- 1509 Hardin Ave
- 107 E Michigan Ave
- 406 S East St
- 401 S East St
- 1434 S East St
- 227 Anna St
- 209 E Beecher Ave
- 440 S Sandy St
- 205 E Pennsylvania Ave
- 697 E State St
- 1612 Elmwood St
- None None St
- 812 Hardin Ave
- 826 Hardin Ave
- 836 Hardin Ave
- 811 Hardin Ave
- 806 Hardin Ave
- 635 E Morton Ave
- 624 E Morton Ave
- 752 Hardin Ave
- 845 Hardin Ave
- 847 Hardin Ave
- 744 Hardin Ave
- 853 Hardin Ave
- 1002 Hardin Ave
- 745 Hardin Ave
- 738 Hardin Ave
- 918 Goltra Ave
- 857 Hardin Ave
- 601 E Morton Ave
- 920 Goltra Ave
- 743 Hardin Ave