816 S 7th St Ponca City, OK 74601
Estimated Value: $92,000 - $148,000
3
Beds
2
Baths
2,217
Sq Ft
$54/Sq Ft
Est. Value
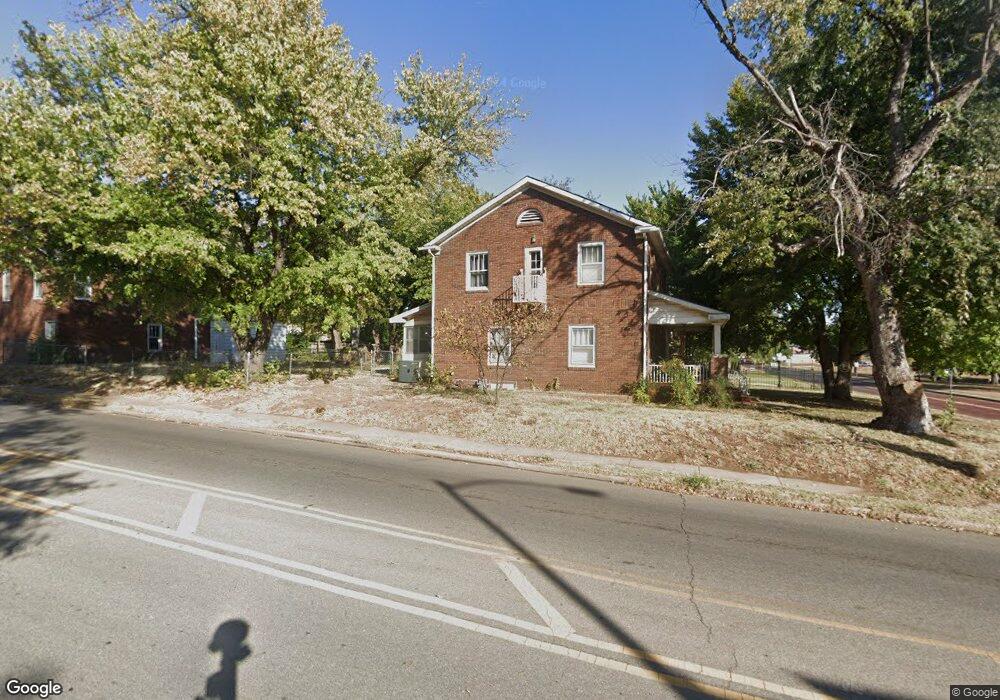
About This Home
This home is located at 816 S 7th St, Ponca City, OK 74601 and is currently estimated at $118,778, approximately $53 per square foot. 816 S 7th St is a home located in Kay County with nearby schools including Garfield Elementary School, Ponca City East Middle School, and Ponca City West Middle School.
Ownership History
Date
Name
Owned For
Owner Type
Purchase Details
Closed on
Jun 16, 2011
Sold by
Nuckols Ron G and Nuckols Sherri A
Bought by
Weers Robert L and Weers Dixie
Current Estimated Value
Home Financials for this Owner
Home Financials are based on the most recent Mortgage that was taken out on this home.
Original Mortgage
$26,249
Interest Rate
4.91%
Mortgage Type
Purchase Money Mortgage
Purchase Details
Closed on
Apr 19, 2011
Sold by
Patterson Patricia A
Bought by
Nuckols Ron G and Nuckols Sherri A
Home Financials for this Owner
Home Financials are based on the most recent Mortgage that was taken out on this home.
Original Mortgage
$26,249
Interest Rate
4.91%
Mortgage Type
Purchase Money Mortgage
Create a Home Valuation Report for This Property
The Home Valuation Report is an in-depth analysis detailing your home's value as well as a comparison with similar homes in the area
Home Values in the Area
Average Home Value in this Area
Purchase History
| Date | Buyer | Sale Price | Title Company |
|---|---|---|---|
| Weers Robert L | $36,000 | -- | |
| Nuckols Ron G | $22,500 | -- |
Source: Public Records
Mortgage History
| Date | Status | Borrower | Loan Amount |
|---|---|---|---|
| Previous Owner | Nuckols Ron G | $26,249 |
Source: Public Records
Tax History Compared to Growth
Tax History
| Year | Tax Paid | Tax Assessment Tax Assessment Total Assessment is a certain percentage of the fair market value that is determined by local assessors to be the total taxable value of land and additions on the property. | Land | Improvement |
|---|---|---|---|---|
| 2024 | $581 | $6,136 | $554 | $5,582 |
| 2023 | $581 | $5,843 | $554 | $5,289 |
| 2022 | $530 | $5,565 | $554 | $5,011 |
| 2021 | $532 | $5,565 | $554 | $5,011 |
| 2020 | $526 | $5,552 | $554 | $4,998 |
| 2019 | $505 | $5,288 | $554 | $4,734 |
| 2018 | $512 | $5,286 | $554 | $4,732 |
| 2017 | $518 | $5,286 | $554 | $4,732 |
| 2016 | $523 | $5,286 | $554 | $4,732 |
| 2015 | $527 | $5,303 | $554 | $4,749 |
| 2014 | $513 | $5,260 | $554 | $4,706 |
Source: Public Records
Map
Nearby Homes