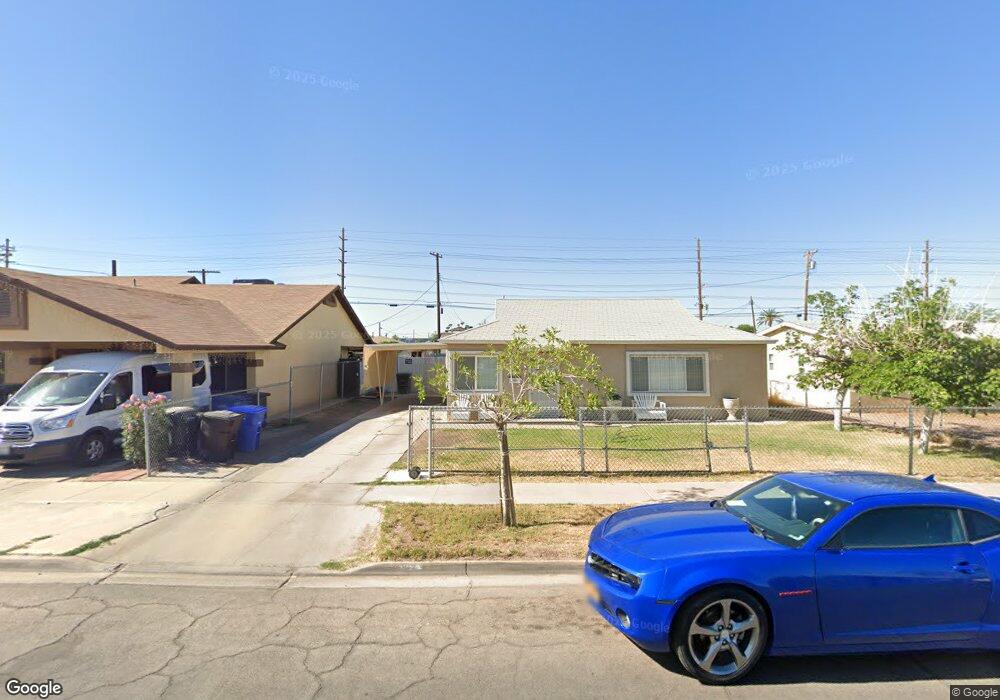
817 Stacey Ave El Centro, CA 92243
Estimated Value: $312,915 - $344,000
--
Bed
--
Bath
1,332
Sq Ft
$243/Sq Ft
Est. Value
About This Home
This home is located at 817 Stacey Ave, El Centro, CA 92243 and is currently estimated at $324,229, approximately $243 per square foot. 817 Stacey Ave is a home located in Imperial County with nearby schools including McKinley Elementary School, Kennedy Middle School, and Southwest High School.
Ownership History
Date
Name
Owned For
Owner Type
Purchase Details
Closed on
May 29, 2002
Sold by
Eugenio John and Almueti Joann
Bought by
Gutierrez Rafael and Gutierrez Jacqueline
Current Estimated Value
Home Financials for this Owner
Home Financials are based on the most recent Mortgage that was taken out on this home.
Original Mortgage
$97,440
Interest Rate
6.52%
Mortgage Type
FHA
Purchase Details
Closed on
Mar 18, 2002
Sold by
Eugenio Valorie J
Bought by
Eugenio John E
Purchase Details
Closed on
Oct 10, 2001
Sold by
Howard Carol Lynn
Bought by
Eugenio John E
Purchase Details
Closed on
Jun 12, 2001
Sold by
Eugenio Fern Marie
Bought by
Howard Carol Lynn
Create a Home Valuation Report for This Property
The Home Valuation Report is an in-depth analysis detailing your home's value as well as a comparison with similar homes in the area
Home Values in the Area
Average Home Value in this Area
Purchase History
| Date | Buyer | Sale Price | Title Company |
|---|---|---|---|
| Gutierrez Rafael | $100,000 | Chicago Title Co | |
| Eugenio John E | -- | Chicago Title Co | |
| Eugenio Danny Ray | -- | Chicago Title Co | |
| Howard Carol Lynn | -- | Chicago Title Co | |
| Eugenio Robert Shaw | -- | Chicago Title Co | |
| Eugenio Tait Adelaida Gloria | -- | Chicago Title Co | |
| Eugenio John E | -- | -- | |
| Howard Carol Lynn | -- | -- |
Source: Public Records
Mortgage History
| Date | Status | Borrower | Loan Amount |
|---|---|---|---|
| Previous Owner | Gutierrez Rafael | $97,440 | |
| Closed | Gutierrez Rafael | $15,370 |
Source: Public Records
Tax History Compared to Growth
Tax History
| Year | Tax Paid | Tax Assessment Tax Assessment Total Assessment is a certain percentage of the fair market value that is determined by local assessors to be the total taxable value of land and additions on the property. | Land | Improvement |
|---|---|---|---|---|
| 2025 | $1,696 | $159,296 | $49,231 | $110,065 |
| 2023 | $1,696 | $153,112 | $47,320 | $105,792 |
| 2022 | $1,616 | $150,111 | $46,393 | $103,718 |
| 2021 | $1,574 | $147,169 | $45,484 | $101,685 |
| 2020 | $1,603 | $145,661 | $45,018 | $100,643 |
| 2019 | $1,553 | $142,806 | $44,136 | $98,670 |
| 2018 | $1,543 | $140,007 | $43,271 | $96,736 |
| 2017 | $1,526 | $137,263 | $42,423 | $94,840 |
| 2016 | $1,494 | $134,573 | $41,592 | $92,981 |
| 2015 | $1,471 | $132,553 | $40,968 | $91,585 |
| 2014 | $847 | $78,588 | $30,000 | $48,588 |
Source: Public Records
Map
Nearby Homes
- 796 Stacey Ave
- 1034 Woodward Ave
- 1027 Rose Ave
- 1444 Highway 86
- 583 El Centro Ave
- 874 W Pico Ave
- 1066 W Pico Ave
- 1751 N 8th St
- 1751 N McDonald St
- 1751 N McDonald St Unit 153
- 436 W Euclid Ave
- 1630 Adams Ave Unit 2
- 314 Magnolia Ave
- 310 Magnolia Ave
- 470 W Olive Ave
- 566 W Brighton Ave
- 464 W Olive Ave Unit 464
- 1653 W Barbara Worth Dr Unit 1653
- 1027 W Holt Ave
- 1066 W Heil Ave
- 827 Stacey Ave
- 807 Stacey Ave
- 827 0 Stacey Ave
- 837 Stacey Ave
- 847 Stacey Ave
- 818 Stacey Ave
- 828 Stacey Ave
- 808 Stacey Ave
- 799 Stacey Ave
- 838 Stacey Ave
- 857 Stacey Ave
- 848 Stacey Ave
- 814 Woodward Ave
- 789 Stacey Ave
- 824 Woodward Ave
- 858 Stacey Ave
- 867 Stacey Ave
- 867 Stacey Ave
- 834 Woodward Ave
- 817 Scott Ave