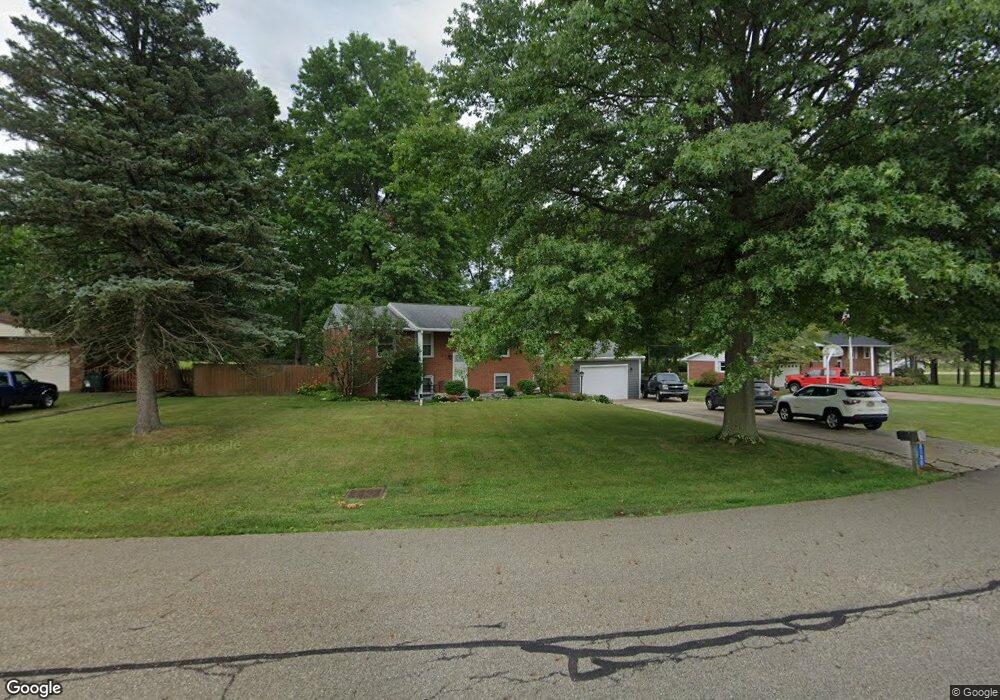
8180 Ruble Ave Louisville, OH 44641
Estimated Value: $236,000 - $271,000
3
Beds
3
Baths
1,242
Sq Ft
$200/Sq Ft
Est. Value
About This Home
This home is located at 8180 Ruble Ave, Louisville, OH 44641 and is currently estimated at $248,337, approximately $199 per square foot. 8180 Ruble Ave is a home located in Stark County with nearby schools including Louisville High School and St. Thomas Aquinas High School & Middle School.
Ownership History
Date
Name
Owned For
Owner Type
Purchase Details
Closed on
Nov 10, 2005
Sold by
Thompson Jeri L
Bought by
Zorger Clint N and Zorger Tisha M
Current Estimated Value
Home Financials for this Owner
Home Financials are based on the most recent Mortgage that was taken out on this home.
Original Mortgage
$114,240
Outstanding Balance
$66,726
Interest Rate
7.14%
Mortgage Type
Fannie Mae Freddie Mac
Estimated Equity
$181,611
Purchase Details
Closed on
Jun 28, 2002
Sold by
Mcalexander Matthew Travis
Bought by
Thompson Jeri L
Purchase Details
Closed on
Mar 1, 2000
Sold by
Anthony Kevin C and Anthony Myers L
Bought by
Mcalexander Matthew Travis and Thompson Jeri L
Home Financials for this Owner
Home Financials are based on the most recent Mortgage that was taken out on this home.
Original Mortgage
$115,425
Interest Rate
9.99%
Mortgage Type
Purchase Money Mortgage
Purchase Details
Closed on
Mar 30, 1992
Create a Home Valuation Report for This Property
The Home Valuation Report is an in-depth analysis detailing your home's value as well as a comparison with similar homes in the area
Home Values in the Area
Average Home Value in this Area
Purchase History
| Date | Buyer | Sale Price | Title Company |
|---|---|---|---|
| Zorger Clint N | $142,800 | -- | |
| Thompson Jeri L | -- | -- | |
| Mcalexander Matthew Travis | $121,500 | Mk Title Agency Of Stark Cou | |
| -- | $77,000 | -- |
Source: Public Records
Mortgage History
| Date | Status | Borrower | Loan Amount |
|---|---|---|---|
| Open | Zorger Clint N | $114,240 | |
| Previous Owner | Mcalexander Matthew Travis | $115,425 | |
| Closed | Mcalexander Matthew Travis | $15,000 |
Source: Public Records
Tax History Compared to Growth
Tax History
| Year | Tax Paid | Tax Assessment Tax Assessment Total Assessment is a certain percentage of the fair market value that is determined by local assessors to be the total taxable value of land and additions on the property. | Land | Improvement |
|---|---|---|---|---|
| 2025 | -- | $76,240 | $14,810 | $61,430 |
| 2024 | -- | $76,240 | $14,810 | $61,430 |
| 2023 | $6,549 | $63,070 | $10,780 | $52,290 |
| 2022 | $3,072 | $63,070 | $10,780 | $52,290 |
| 2021 | $3,081 | $63,070 | $10,780 | $52,290 |
| 2020 | $2,499 | $54,040 | $9,240 | $44,800 |
| 2019 | $2,509 | $54,040 | $9,240 | $44,800 |
| 2018 | $2,501 | $54,040 | $9,240 | $44,800 |
| 2017 | $2,268 | $46,770 | $8,720 | $38,050 |
| 2016 | $2,176 | $45,890 | $8,720 | $37,170 |
| 2015 | $2,182 | $45,890 | $8,720 | $37,170 |
| 2014 | $174 | $42,320 | $8,050 | $34,270 |
| 2013 | $982 | $38,080 | $8,050 | $30,030 |
Source: Public Records
Map
Nearby Homes
- 7844 Morningstar Dr
- 6079 Eastlawn St NE
- 6285 California Ave
- 6052 N Nickelplate St
- 5700 Glena St
- 6150 Pilot View Cir
- 3580 Brookridge Ave Lot 15
- 5474 Ravenna Ave
- 7875 Bentler Ave NE
- 0 Glenbar St
- 0 Pilot Knob Ave NE
- 0 Brookridge Ave
- 524 Glenbar St
- 316 E Reno Dr
- 614 Reno Dr
- 5495 Meese Rd NE
- 1561 Noel St
- 910 Crosswyck Cir
- 428 Honeycrisp Dr NE
- 3047 Mcintosh Dr NE
- 8200 Ruble Ave
- 8150 Ruble Ave
- 8222 Ruble Ave
- 7710 Bellhurst St
- 7707 Bellhurst St
- 8232 Ruble Ave
- 7690 Bellhurst St
- 7751 Tabernacle St
- 7721 Tabernacle St
- 7721 Tabernacle St NE
- 7701 Tabernacle St
- 7667 Bellhurst St
- 7667 Bellhurst St
- 7710 Brownhurst St
- 7681 Tabernacle St
- 8272 Ruble Ave
- 8272 Ruble Ave NE
- 7650 Bellhurst St
- 7686 Brownhurst St
- 7651 Bellhurst St