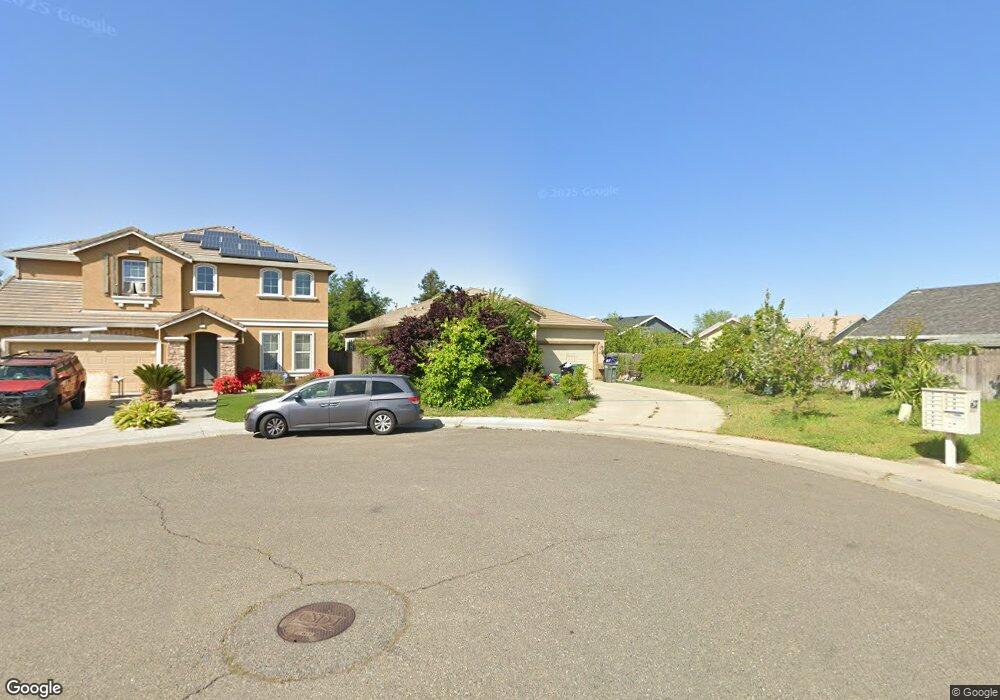
8199 Leilani Ct Sacramento, CA 95828
Estimated Value: $347,000 - $526,000
4
Beds
3
Baths
1,804
Sq Ft
$259/Sq Ft
Est. Value
About This Home
This home is located at 8199 Leilani Ct, Sacramento, CA 95828 and is currently estimated at $467,201, approximately $258 per square foot. 8199 Leilani Ct is a home located in Sacramento County with nearby schools including Anna Kirchgater Elementary School, James Rutter Middle School, and Florin High School.
Ownership History
Date
Name
Owned For
Owner Type
Purchase Details
Closed on
Sep 21, 2010
Sold by
Iona Builders Llc
Bought by
Peterson Lisa
Current Estimated Value
Home Financials for this Owner
Home Financials are based on the most recent Mortgage that was taken out on this home.
Original Mortgage
$211,637
Outstanding Balance
$140,176
Interest Rate
4.5%
Mortgage Type
FHA
Estimated Equity
$327,025
Purchase Details
Closed on
Jul 30, 2010
Sold by
Smarie Investments Llc
Bought by
Iona Builders Llc
Home Financials for this Owner
Home Financials are based on the most recent Mortgage that was taken out on this home.
Original Mortgage
$211,637
Outstanding Balance
$140,176
Interest Rate
4.5%
Mortgage Type
FHA
Estimated Equity
$327,025
Purchase Details
Closed on
Aug 27, 2009
Sold by
United Security Bank
Bought by
Smarie Investments Llc
Create a Home Valuation Report for This Property
The Home Valuation Report is an in-depth analysis detailing your home's value as well as a comparison with similar homes in the area
Home Values in the Area
Average Home Value in this Area
Purchase History
| Date | Buyer | Sale Price | Title Company |
|---|---|---|---|
| Peterson Lisa | $214,500 | Old Republic Title Company | |
| Iona Builders Llc | -- | None Available | |
| Smarie Investments Llc | $180,000 | First American Title Company |
Source: Public Records
Mortgage History
| Date | Status | Borrower | Loan Amount |
|---|---|---|---|
| Open | Peterson Lisa | $211,637 |
Source: Public Records
Tax History Compared to Growth
Tax History
| Year | Tax Paid | Tax Assessment Tax Assessment Total Assessment is a certain percentage of the fair market value that is determined by local assessors to be the total taxable value of land and additions on the property. | Land | Improvement |
|---|---|---|---|---|
| 2025 | $3,930 | $274,800 | $46,116 | $228,684 |
| 2024 | $3,930 | $269,412 | $45,212 | $224,200 |
| 2023 | $3,587 | $264,130 | $44,326 | $219,804 |
| 2022 | $3,465 | $258,952 | $43,457 | $215,495 |
| 2021 | $2,965 | $253,875 | $42,605 | $211,270 |
| 2020 | $2,927 | $251,273 | $42,169 | $209,104 |
| 2019 | $3,789 | $246,347 | $41,343 | $205,004 |
| 2018 | $2,879 | $241,518 | $40,533 | $200,985 |
| 2017 | $2,757 | $236,784 | $39,739 | $197,045 |
| 2016 | $2,627 | $232,142 | $38,960 | $193,182 |
| 2015 | $2,581 | $228,656 | $38,375 | $190,281 |
| 2014 | $2,540 | $224,178 | $37,624 | $186,554 |
Source: Public Records
Map
Nearby Homes
- 8266 Summer Sunset Dr
- 7905 Springarden Way
- 8282 Union Creek Way
- 8205 Weyburn Ct
- 4.13 ACR Lenhart Rd
- 8336 Summer Sunset Dr
- 8077 Goran Ct
- 8346 Floxtree Ct
- 8016 Stevenson Ave
- 7901 Stevenson Ave
- 8186 Gustine Way
- 7711 Lenhart Rd
- 8095 E Stockton Blvd
- 8013 Skywoods Way
- 8336 Cutler Way
- 0 Rangeview Ln
- 8012 Northern Oak Cir
- 7422 Sun Point Ln
- 7956 Orchard Woods Cir
- 7724 La Bandera Way
- 8195 Leilani Ct
- 8220 Summer Falls Cir
- 8216 Summer Falls Cir
- 8224 Summer Falls Cir
- 8191 Leilani Ct
- 8212 Summer Falls Cir
- 8198 Leilani Ct
- 8194 Leilani Ct
- 8208 Summer Falls Cir
- 8228 Summer Falls Cir
- 7925 Iona Way
- 8190 Leilani Ct
- 7921 Iona Way
- 8232 Summer Falls Cir
- 8217 Summer Falls Cir
- 7935 Iona Way
- 8221 Summer Falls Cir
- 8213 Summer Falls Cir
- 7945 Iona Way
- 8209 Summer Falls Cir