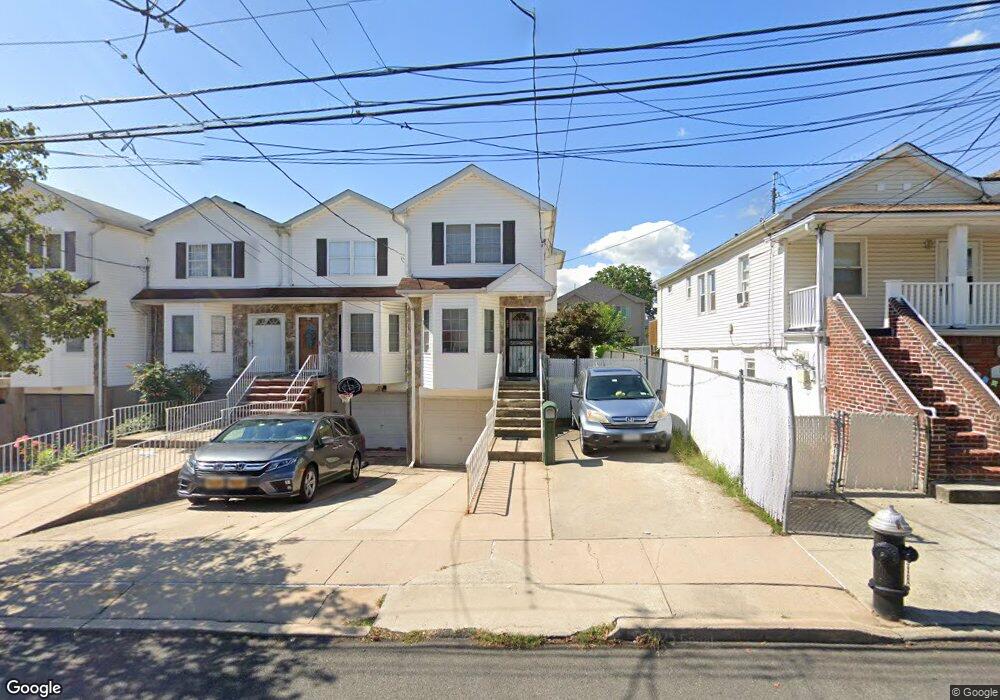
82 Arthur Ave Staten Island, NY 10305
South Beach NeighborhoodEstimated Value: $750,185 - $809,000
--
Bed
4
Baths
1,796
Sq Ft
$434/Sq Ft
Est. Value
About This Home
This home is located at 82 Arthur Ave, Staten Island, NY 10305 and is currently estimated at $780,296, approximately $434 per square foot. 82 Arthur Ave is a home located in Richmond County with nearby schools including P.S. 39 The Francis J. Murphy Jr. School, I.S. 49 Berta A Dreyfus, and Curtis High School.
Ownership History
Date
Name
Owned For
Owner Type
Purchase Details
Closed on
Aug 23, 2000
Sold by
Terra Estates Inc
Bought by
Ho Chien Shing and Ho Maria Tam
Current Estimated Value
Home Financials for this Owner
Home Financials are based on the most recent Mortgage that was taken out on this home.
Original Mortgage
$185,000
Outstanding Balance
$66,037
Interest Rate
8%
Estimated Equity
$714,259
Purchase Details
Closed on
Dec 22, 1998
Sold by
Church Of The Holy Rosary
Bought by
Terra Estates Inc
Create a Home Valuation Report for This Property
The Home Valuation Report is an in-depth analysis detailing your home's value as well as a comparison with similar homes in the area
Home Values in the Area
Average Home Value in this Area
Purchase History
| Date | Buyer | Sale Price | Title Company |
|---|---|---|---|
| Ho Chien Shing | $213,000 | First American Title Ins Co | |
| Terra Estates Inc | $450,000 | -- |
Source: Public Records
Mortgage History
| Date | Status | Borrower | Loan Amount |
|---|---|---|---|
| Open | Ho Chien Shing | $185,000 |
Source: Public Records
Tax History Compared to Growth
Tax History
| Year | Tax Paid | Tax Assessment Tax Assessment Total Assessment is a certain percentage of the fair market value that is determined by local assessors to be the total taxable value of land and additions on the property. | Land | Improvement |
|---|---|---|---|---|
| 2025 | $6,470 | $46,860 | $7,384 | $39,476 |
| 2024 | $6,482 | $41,520 | $7,966 | $33,554 |
| 2023 | $6,155 | $31,709 | $7,603 | $24,106 |
| 2022 | $5,879 | $36,960 | $9,840 | $27,120 |
| 2021 | $5,864 | $37,380 | $9,840 | $27,540 |
| 2020 | $5,907 | $35,460 | $9,840 | $25,620 |
| 2019 | $5,566 | $30,840 | $9,840 | $21,000 |
| 2018 | $5,089 | $26,424 | $7,382 | $19,042 |
| 2017 | $4,947 | $25,740 | $9,840 | $15,900 |
| 2016 | $4,572 | $24,420 | $9,840 | $14,580 |
| 2015 | $4,174 | $24,741 | $8,070 | $16,671 |
| 2014 | $4,174 | $23,341 | $7,650 | $15,691 |
Source: Public Records
Map
Nearby Homes