82 Gorman St Oakland, MD 21550
Estimated Value: $157,396 - $179,000
--
Bed
2
Baths
2,304
Sq Ft
$72/Sq Ft
Est. Value
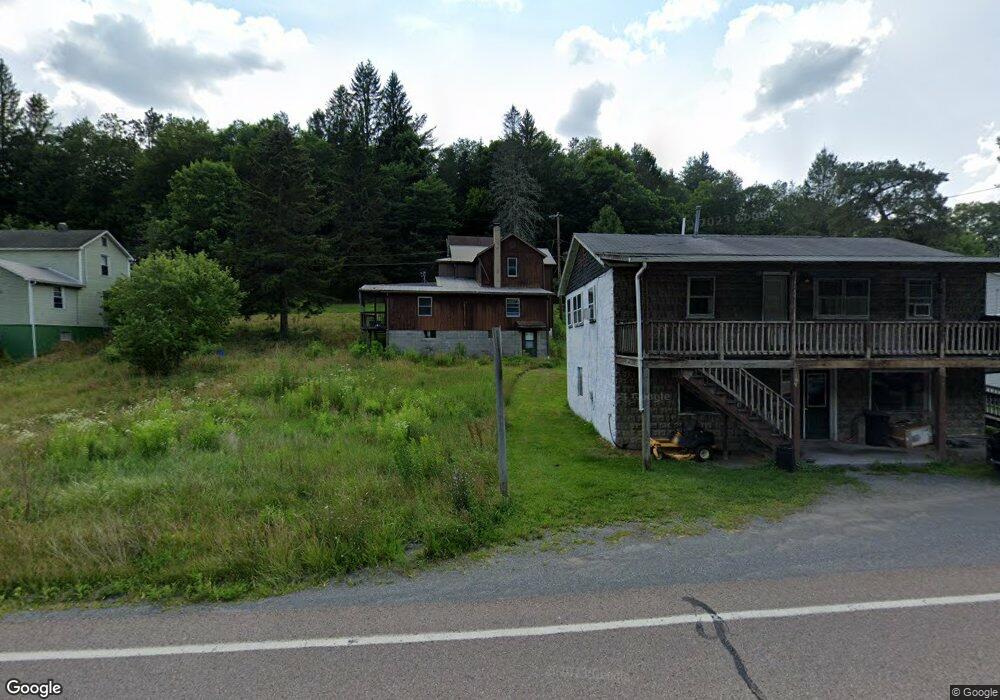
About This Home
This home is located at 82 Gorman St, Oakland, MD 21550 and is currently estimated at $165,349, approximately $71 per square foot. 82 Gorman St is a home located in Garrett County with nearby schools including Yough Glades Elementary School, Swan Meadow School, and Southern Middle School.
Ownership History
Date
Name
Owned For
Owner Type
Purchase Details
Closed on
Aug 5, 2024
Sold by
Collector Amanda Klotz
Bought by
Tasker Deanna Dale
Current Estimated Value
Purchase Details
Closed on
Oct 19, 2006
Sold by
Ware Fred L
Bought by
Geare Diana R
Home Financials for this Owner
Home Financials are based on the most recent Mortgage that was taken out on this home.
Original Mortgage
$48,060
Interest Rate
6.75%
Mortgage Type
Purchase Money Mortgage
Purchase Details
Closed on
Oct 18, 2006
Sold by
Ware Fred L
Bought by
Geare Diana R
Home Financials for this Owner
Home Financials are based on the most recent Mortgage that was taken out on this home.
Original Mortgage
$48,060
Interest Rate
6.75%
Mortgage Type
Purchase Money Mortgage
Purchase Details
Closed on
Mar 11, 2005
Sold by
Ware Rodger L
Bought by
Ware Fred L
Purchase Details
Closed on
Mar 10, 2004
Sold by
Ware Fred L and Ware Mary D
Bought by
Ware Rodger L
Purchase Details
Closed on
Feb 27, 2004
Sold by
Ware Fred L and Ware Mary D
Bought by
Ware Rodger L
Create a Home Valuation Report for This Property
The Home Valuation Report is an in-depth analysis detailing your home's value as well as a comparison with similar homes in the area
Home Values in the Area
Average Home Value in this Area
Purchase History
| Date | Buyer | Sale Price | Title Company |
|---|---|---|---|
| Tasker Deanna Dale | -- | None Listed On Document | |
| Geare Diana R | $54,000 | -- | |
| Geare Diana R | $54,000 | -- | |
| Ware Fred L | -- | -- | |
| Ware Rodger L | -- | -- | |
| Ware Rodger L | -- | -- |
Source: Public Records
Mortgage History
| Date | Status | Borrower | Loan Amount |
|---|---|---|---|
| Previous Owner | Geare Diana R | $48,060 | |
| Previous Owner | Geare Diana R | $48,060 |
Source: Public Records
Tax History Compared to Growth
Tax History
| Year | Tax Paid | Tax Assessment Tax Assessment Total Assessment is a certain percentage of the fair market value that is determined by local assessors to be the total taxable value of land and additions on the property. | Land | Improvement |
|---|---|---|---|---|
| 2025 | $637 | $56,267 | $0 | $0 |
| 2024 | $603 | $51,633 | $0 | $0 |
| 2023 | $549 | $47,000 | $2,800 | $44,200 |
| 2022 | $547 | $46,867 | $0 | $0 |
| 2021 | $546 | $46,733 | $0 | $0 |
| 2020 | $403 | $46,600 | $2,800 | $43,800 |
| 2019 | $544 | $46,600 | $2,800 | $43,800 |
| 2018 | $513 | $46,600 | $2,800 | $43,800 |
| 2017 | $537 | $48,700 | $0 | $0 |
| 2016 | -- | $48,700 | $0 | $0 |
| 2015 | -- | $48,700 | $0 | $0 |
| 2014 | -- | $48,900 | $0 | $0 |
Source: Public Records
Map
Nearby Homes
- 60 Gorman St
- 9412 George Washington Hwy
- 9452 George Washington Hwy
- 0 George Washington Hwy Unit Lot WP001 18623689
- 0 George Washington Hwy Unit MDGA2010274
- 0 George Washington Hwy Unit MDGA2006062
- 2141 Front St
- 63 Wallman Rd
- 1737 King Wildesen Rd
- 13529 George Washington Hwy
- 355 Lonesome Pine Rd
- 0 Cherry Ridge Rd Unit WVGT2001102
- 0 Cherry Ridge Rd Unit WVGT2001088
- 3501 George Washington Hwy
- 415 Nazelrod Rd
- 421 Head Rd
- 0 Bethlehem Rd
- 210 Seneca Ave
- 102 Roanoke Ave
- Lots 26-29 E Third Ave
- 197 Gorman Rd
- 83 Gorman St
- 217 Gorman Rd
- 190 Gorman Rd
- 226 Gorman Rd
- 95 Gorman St
- 95 Gorman St
- 26 Gorman St
- 231 Gorman Rd
- 137 Gorman St
- 57 Steyer Gorman Rd
- 47 Steyer Gorman Rd
- 270 Gorman Rd
- 0 Gorman St
- 77 Steyer Gorman Rd
- 42 Steyer Gorman Rd
- 68 Steyer Gorman Rd
- 179 Gorman St
- 223 Gorman St
- 9155 George Washington Hwy